


Available under Creative Commons-ShareAlike 4.0 International License.
Data can be entered as follows:
    distance=[0 24 48 72 96];
time=[0 5 10 15 20];
we can now plot the data by typing in
plot(time,distance);title('Distance-Time Graph');xlabel('time');ylabel('distance');
at the MATLAB prompt. The following plot is generated, select Tools > Basic Fitting: 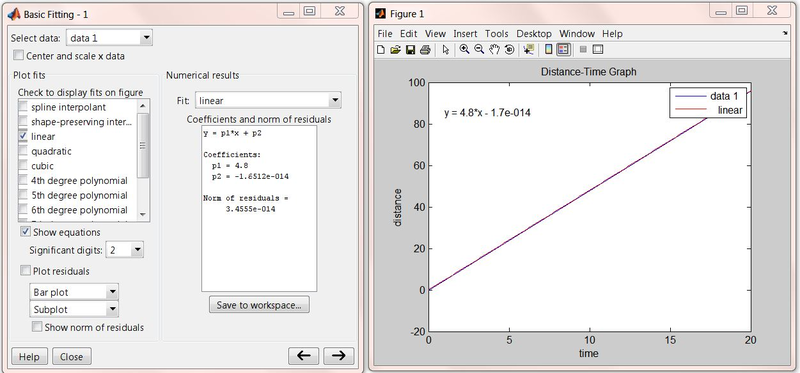
As shown above, the relationship between distance and time is:
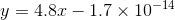
or

- 瀏覽次數:1862
