


Available under Creative Commons-ShareAlike 4.0 International License.
If you want to merge data from two graphs, rather than create a new graph from scratch, you can superimpose the two using a simple trick:
    % This script generates sin(x) and cos(x) plot on the same graph
% initialize variables
x=[-pi:.1:pi];      %create a row vector from -pi to +pi with .1 increments
y0=sin(x);          %calculate sine value for each x
y1=cos(x);          %calculate cosine value for each x
% Plot sin(x) and cos(x) on the same graph
plot(x,y0,x,y1);
title('Graph of sin(x) and cos(x)'); %Title of graph
xlabel('x');                %Label of x axis
ylabel('sin(x), cos(x)');   %Label of y axis
legend('sin(x)','cos(x)');  %Insert legend in the same order as y0 and y1 calculated
grid on                     %Graph grid is turned
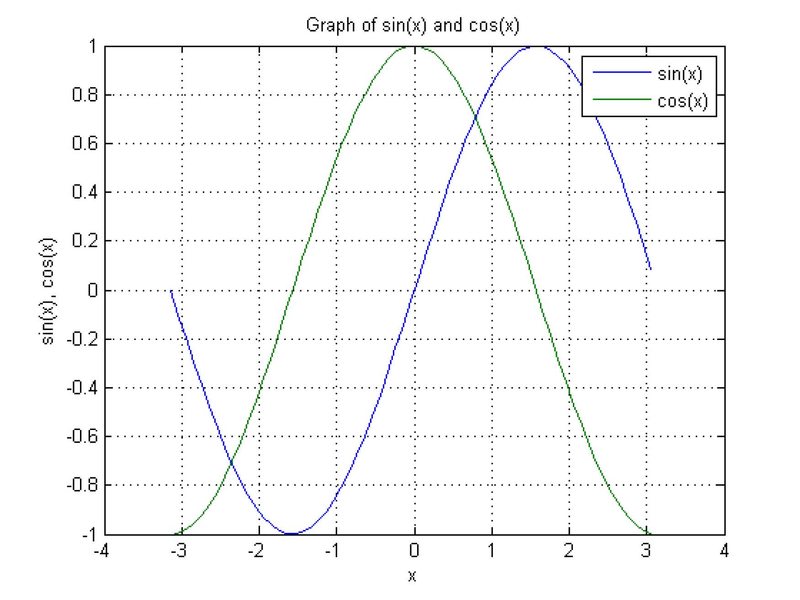
Figure 3.4 Graph of sin(x) and cos(x) in the same plot with labels and legend.
- 瀏覽次數:3655
