


Available under Creative Commons-ShareAlike 4.0 International License.
-
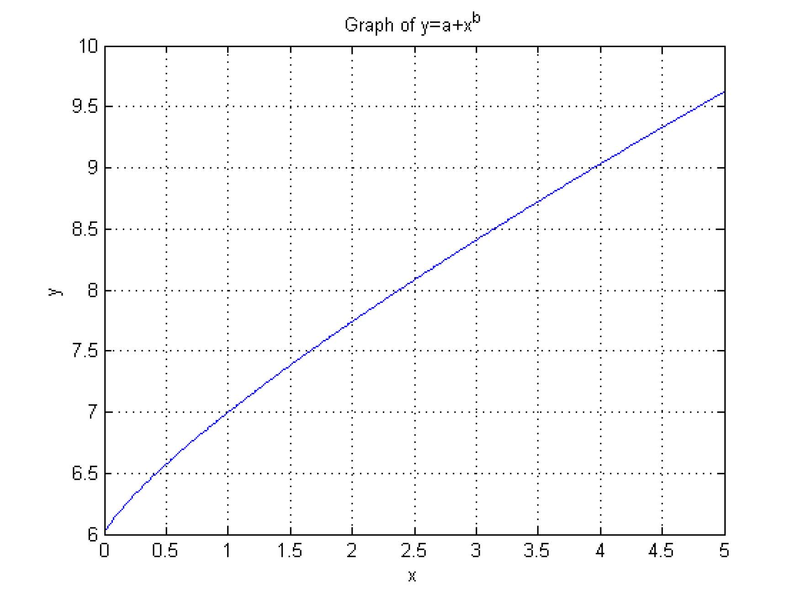
a=6; b=.8; x=[0:.01:5]; y=a+x.^b;
plot(x,y),title('Graph of y=a+x^b'),xlabel('x'),ylabel('y'),grid
-
    a=6; b=.8; x=[0:.01:5]; y=a*x.^b;
plot(x,y),title('Graph of y=ax^b'),xlabel('x'),ylabel('y'),grid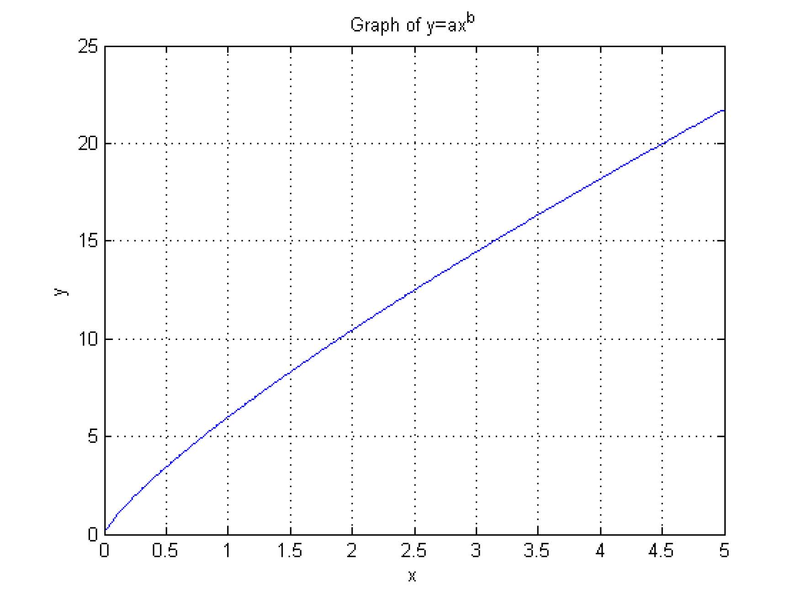
-
 a=6; x=[0:.01:5]; y=a*sin(x);
plot(x,y),title('Graph of y=a*sin(x)'),xlabel('x'),ylabel('y'),grid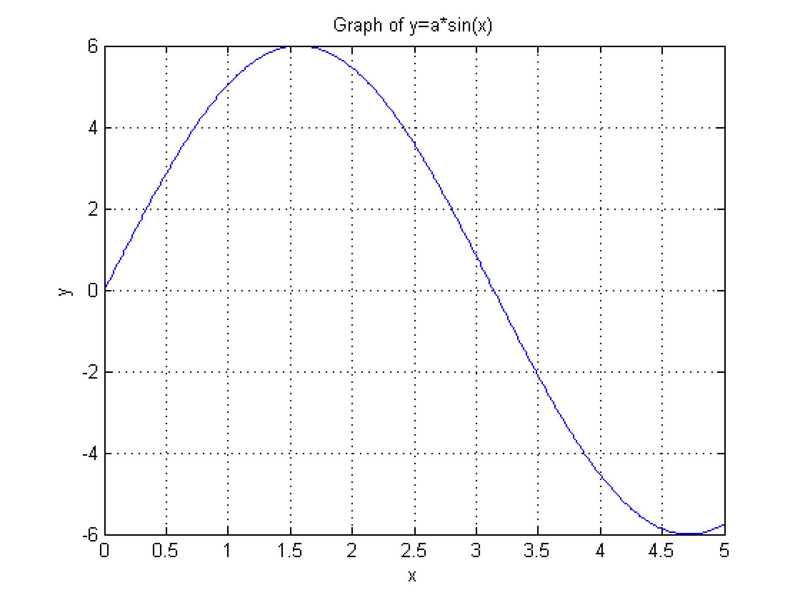
- 1672 reads
