


Available under Creative Commons-ShareAlike 4.0 International License.
Using the data set above, determine the relationship between velocity and time.
First, let us input the variables (Workspace > New variable) as shown in the following figures.
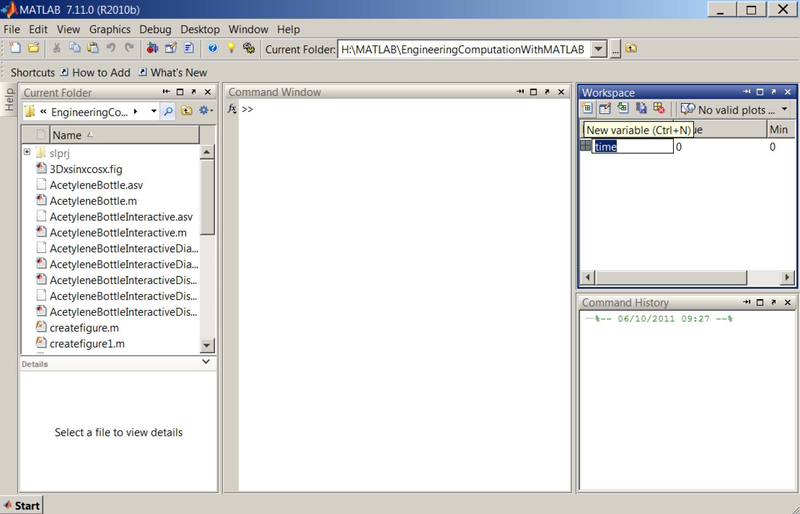
Figure 7.1 A new variable is created in the Workspace.
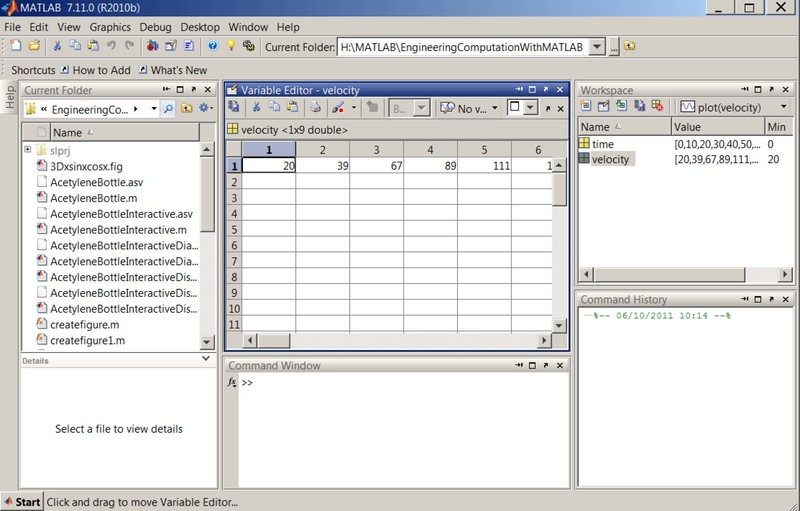
Figure 7.2 New variables are entered in the Variable Editor.
Second, we will plot the data by typing in plot(time,velocity) at the MATLAB prompt. The following plot is generated, select Tools > Basic Fitting:
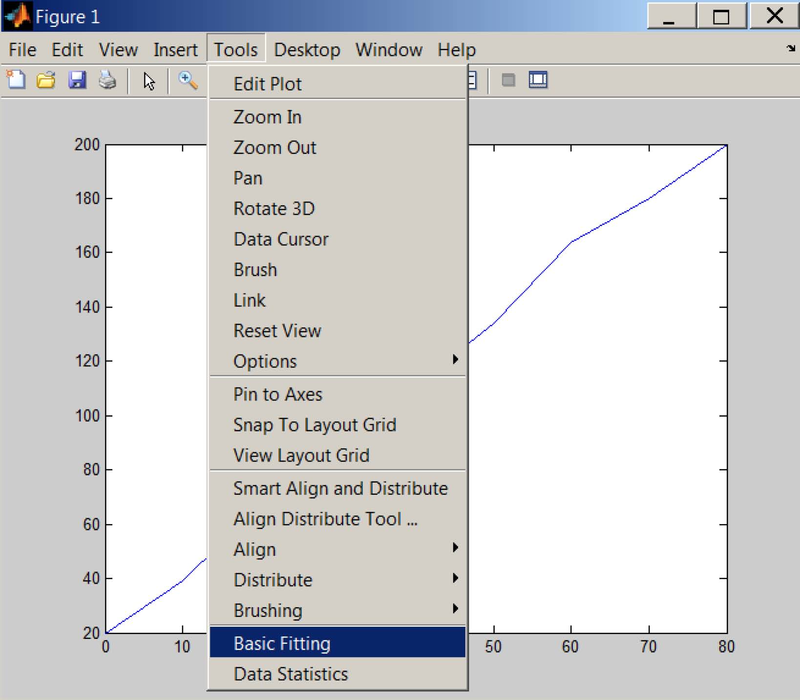
Figure 7.3 A plot is generated. The Basic Fitting tool can be initialized from Tools > Basic Fitting.
In the "Basic Fitting" window, select "linear" and "Show equations". The best fitting linear line along with the corresponding equation are displayed on the plot:
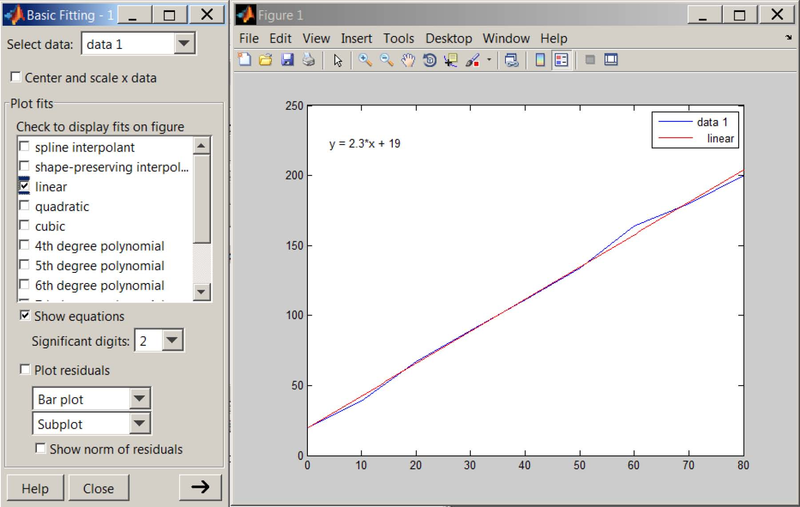
Figure 7.4 Basic Fitting window is used to select the desired regression analysis parameters.
Now let us do another curve fitting and obtain an equation for the function. Using that equation, we can evaluate the function at a desired value with polyval.
- 2329 reads
