


Available under Creative Commons-ShareAlike 4.0 International License.
Write a simple script and publish it in an html file.
Select File > New > Script to create an m-file. Once the editor is opened, type in the following code:
    x = [0:6];  % Create a row vector
y = 1.6*x;  % Compute y as a function of x
[x',y']    % Transpose vectors x and y
plot(x,y),title('Graph of y=f(x)'),xlabel('x'),ylabel('f(x)'),grid % Plot a graph
Save the script as publishing.m and select File > Publish. An HTML file is generated as shown in the figure below:
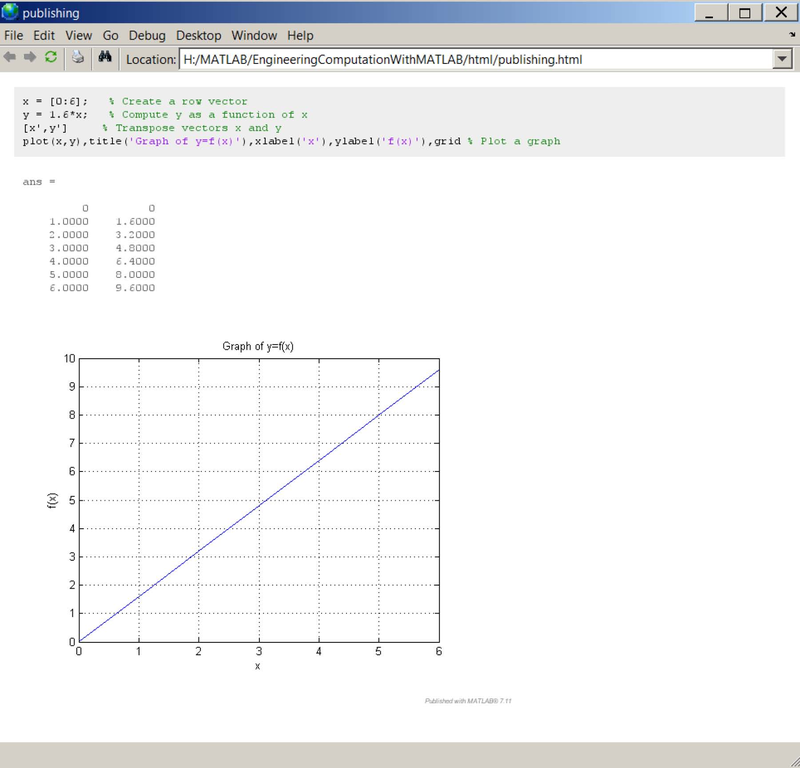
Figure 8.3 A script published in html
- 1750 reads
