


Your instructor will record the heights of both men and women in your class, separately. Draw histograms of your data. Then draw a smooth curve through each histogram. Is each curve somewhat bell-shaped? Do you think that if you had recorded 200 data values for men and 200 for women that the curves would look bell-shaped? Calculate the mean for each data set. Write the means on the x-axis of the appropriate graph below the peak. Shade the approximate area that represents the probability that one randomly chosen male is taller than 72 inches. Shade the approximate area that represents the probability that one randomly chosen female is shorter than 60 inches. If the total area under each curve is one, does either probability appear to be more than 0.5?
The normal distribution has two parameters (two numerical descriptive measures), the mean (µ) and the standard deviation (σ). If X is a quantity to be measured that has a normal distribution with mean (µ) and the standard deviation (σ), we designate this by writing

The probability density function is a rather complicated function. Do not memorize it. It is not necessary.
The cumulative distribution function is P (X<x) . It is calculated either by a calculator or a computer or it is looked up in a table. Technology has made the tables basically obsolete. For that reason, as well as the fact that there are various table formats, we are not including table instructions in this chapter. See the NOTE in this chapter in Calculation of Probabilities.
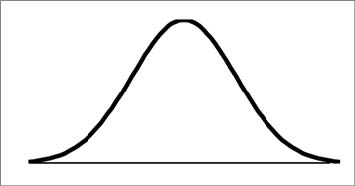
The curve is symmetrical about a vertical line drawn through the mean, µ. In theory, the mean is the same as the median since the graph is symmetric about µ. As the notation indicates, the normal distribution depends only on the mean and the standard deviation. Since the area under the curve must equal one, a change in the standard deviation, σ, causes a change in the shape of the curve; the curve becomes fatter or skinnier depending on σ. A change in µ causes the graph to shift to the left or right. This means there are an infnite number of normal probability distributions. One of special interest is called the standard normal distribution.
- 瀏覽次數:2298
