


In your classroom, try this exercise. Have class members write down the average time (in hours, to the nearest half-hour) they sleep per night. Your instructor will record the data. Then create a simple graph (called a dot plot) of the data. A dot plot consists of a number line and dots (or points) positioned above the number line. For example, consider the following data:
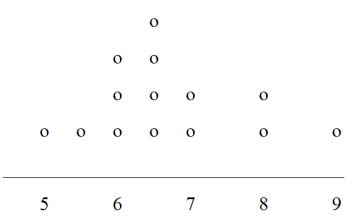
5; 5.5; 6; 6; 6; 6.5; 6.5; 6.5; 6.5; 7; 7; 8; 8; 9
The dot plot for this data would be as follows:
Does your dot plot look the same as or different from the example? Why? If you did the same example in an English class with the same number of students, do you think the results would be the same? Why or why not?
Where do your data appear to cluster? How could you interpret the clustering?
The questions above ask you to analyze and interpret your data. With this example, you have begun your study of statistics.
In this course, you will learn how to organize and summarize data. Organizing and summarizing data is called descriptive statistics. Two ways to summarize data are by graphing and by numbers (for example, fnding an average). After you have studied probability and probability distributions, you will use formal methods for drawing conclusions from "good" data. The formal methods are called inferential statistics. Statistical inference uses probability to determine how confident we can be that the conclusions are correct.
Effective interpretation of data (inference) is based on good procedures for producing data and thoughtful examination of the data. You will encounter what will seem to be too many mathematical formulas for interpreting data. The goal of statistics is not to perform numerous calculations using the formulas, but to gain an understanding of your data. The calculations can be done using a calculator or a computer. The understanding must come from you. If you can thoroughly grasp the basics of statistics, you can be more confident in the decisions you make in life.
- 2976 reads
