


Using the Linear Regression T Test: LinRegTTest
Step 1. In the STAT list editor, enter the X data in list L1 and the Y data in list L2, paired so that the corresponding (x,y) values are next to each other in the lists. (If a particular pair of values is repeated, enter it as many times as it appears in the data.)
Step 2. On the STAT TESTS menu, scroll down with the cursor to select the LinRegTTest. (Be careful to select LinRegTTest as some calculators may also have a different item called LinRegTInt.)
Step 3. On the LinRegTTest input screen enter: Xlist: L1 ; Ylist: L2 ; Freq: 1
Step 4. On the next line, at the prompt β or ρ, highlight " 0" and press ENTER
Step 5. Leave the line for "RegEq:" blank Step 6. Highlight Calculate and press ENTER.
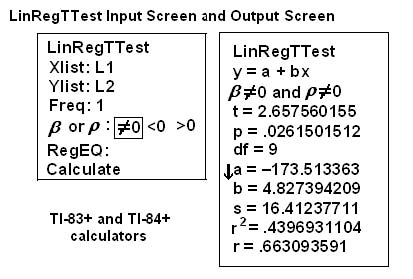
The output screen contains a lot of information. For now we will focus on a few items from the output, and will return later to the other items.
The second line says y = a + bx. Scroll down to find the values a = -173.513, and b = 4.8273 ; the equation of
the best fit line is 
The two items at the bottom are r2 = .43969 and r =.663. For now, just note where to find these values; we will discuss them in the next two sections.
Graphing the Scatterplot and Regression Line
Step 1. We are assuming your X data is already entered in list L1 and your Y data is in list L2
Step 2. Press 2nd STATPLOT ENTER to use Plot 1
Step 3. On the input screen for PLOT 1, highlight On and press ENTER
Step 4. For TYPE: highlight the very first icon which is the scatterplot and press ENTER
Step 5. Indicate Xlist: L1 and Ylist: L2
Step 6. For Mark: it does not matter which symbol you highlight.
Step 7. Press the ZOOM key and then the number 9 (for menu item "ZoomStat") ; the calculator will ft the window to the data
Step 8. To graph the best ft line, press the "Y " key and type the equation -173.5+4.83X into equation Y1. (The X key is immediately left of the STAT key). Press ZOOM 9 again to graph it.
Step 9. Optional: If you want to change the viewing window, press the WINDOW key. Enter your desired window using Xmin, Xmax, Ymin, Ymax
**With contributions from Roberta Bloom
- 瀏覽次數:6524
