


Besides looking at the scatter plot and seeing that a line seems reasonable, how can you tell if the line is a good predictor? Use the correlation coefficient as another indicator (besides the scatterplot) of the strength of the relationship between x and y.
The correlation coefficient, r, developed by Karl Pearson in the early 1900s, is a numerical measure of the strength of association between the independent variable x and the dependent variable y.
The correlation coefficient is calculated as
![r=\frac{n\cdot \sum x\cdot y-(\sum x)\cdot(\sum y)}{\sqrt{[n\cdot \sum x^{2}-(\sum x)^{2}]\cdot[n\cdot\sum y^{2}-(\sum y)^{2}]}}](/system/files/resource/9/9418/9495/media/eqn-img_2.gif)
where n = the number of data points.
If you suspect a linear relationship between x and y, then r can measure how strong the linear relationship is.
What the VALUE of r tells us:
- The value of r is always between -1 and +1: −1 ≤ r ≤ 1.
- The size of the correlation r indicates the strength of the linear relationship between x and y. Values of r close to -1 or to +1 indicate a stronger linear relationship between x and y.
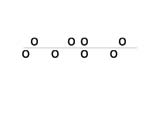
- If r = 0 there is absolutely no linear relationship between x and y (no linear correlation).
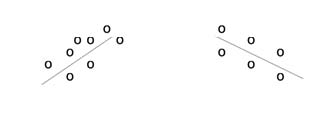
- If r = 1, there is perfect positive correlation. If r = −1, there is perfect negative correlation. In both these cases, all of the original data points lie on a straight line. Of course, in the real world, this will not generally happen.
What the SIGN of r tells us
- A positive value of r means that when x increases, y tends to increase and when x decreases, y tends to decrease (positive correlation).
- A negative value of r means that when x increases, y tends to decrease and when x decreases, y tends to increase (negative correlation).
- The sign of r is the same as the sign of the slope, b, of the best fit line.
The formula for r looks formidable. However, computer spreadsheets, statistical software, and many calculators can quickly calculate r. The correlation coefficient r is the bottom item in the output screens for the LinRegTTest on the TI-83, TI-83+, or TI-84+ calculator (see previous section for instructions).
- 瀏覽次數:3379
