


Testing the significance of the correlation coefficient requires that certain assumptions about the data are satisfied. The premise of this test is that the data are a sample of observed points taken from a larger population. We have not examined the entire population because it is not possible or feasible to do so. We are examining the sample to draw a conclusion about whether the linear relationship that we see between x and y in the sample data provides strong enough evidence so that we can conclude that there is a linear relationship between x and y in the population.
The regression line equation that we calculate from the sample data gives the best fit line for our particular sample. We want to use this best fit line for the sample as an estimate of the best fit line for the population. Examining the scatterplot and testing the significance of the correlation coefficient helps us determine if it is appropriate to do this.
The assumptions underlying the test of significance are:
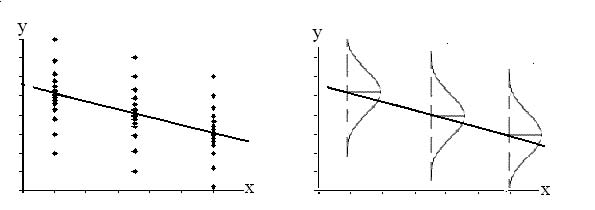
- There is a linear relationship in the population that models the average value of y for varying values of x. In other words, the expected value of y for each particular value lies on a straight line in the population. (We do not know the equation for the line for the population. Our regression line from the sample is our best estimate of this line in the population.)
- The y values for any particular x value are normally distributed about the line. This implies that there are more y values scattered closer to the line than are scattered farther away. Assumption (1) above implies that these normal distributions are centered on the line: the means of these normal distributions of y values lie on the line.
- The standard deviations of the population y values about the line are equal for each value of x. In other words, each of these normal distributions of y values has the same shape and spread about the line.
- The residual errors are mutually independent (no pattern).
**With contributions from Roberta Bloom
- 瀏覽次數:4660
