


Available under Creative Commons-ShareAlike 4.0 International License.
With the X1,Y1,Y2 and Y2 variables still in the workspace, type in plot3(X1,Y1,Y2) at the MATLAB prompt. A figure will be generated, click "Show Plot Tools and Dock Figure".
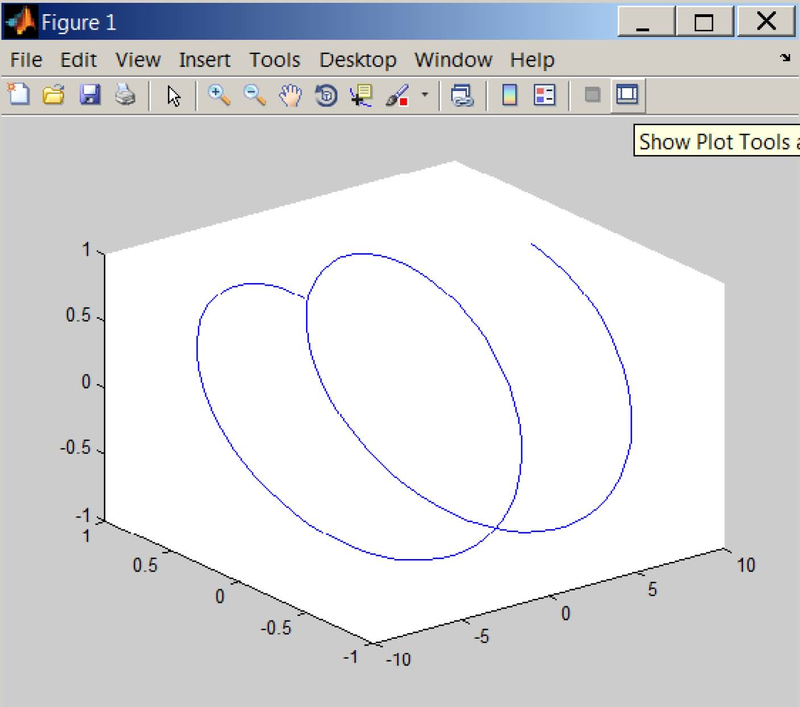
Figure 3.11 A raw 3D figure is generated with plot3.
Use the property editor to make the following changes. Available
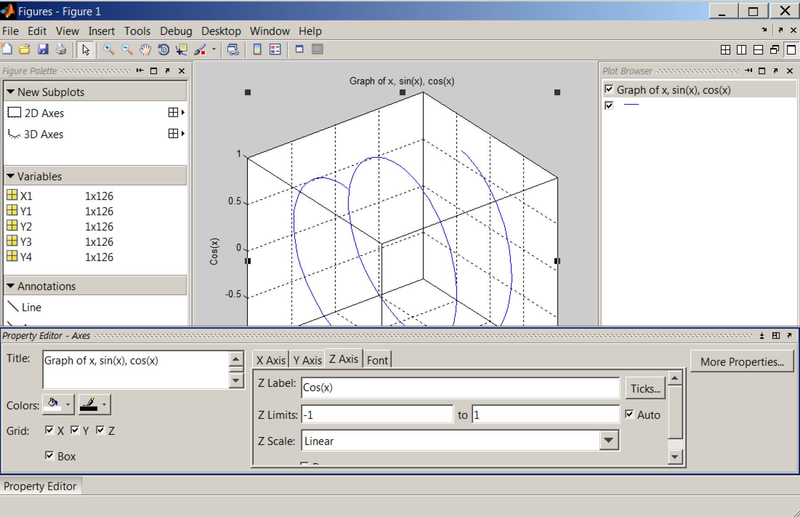
Figure 3.12 3D Property Editor.
The final result should look like this:
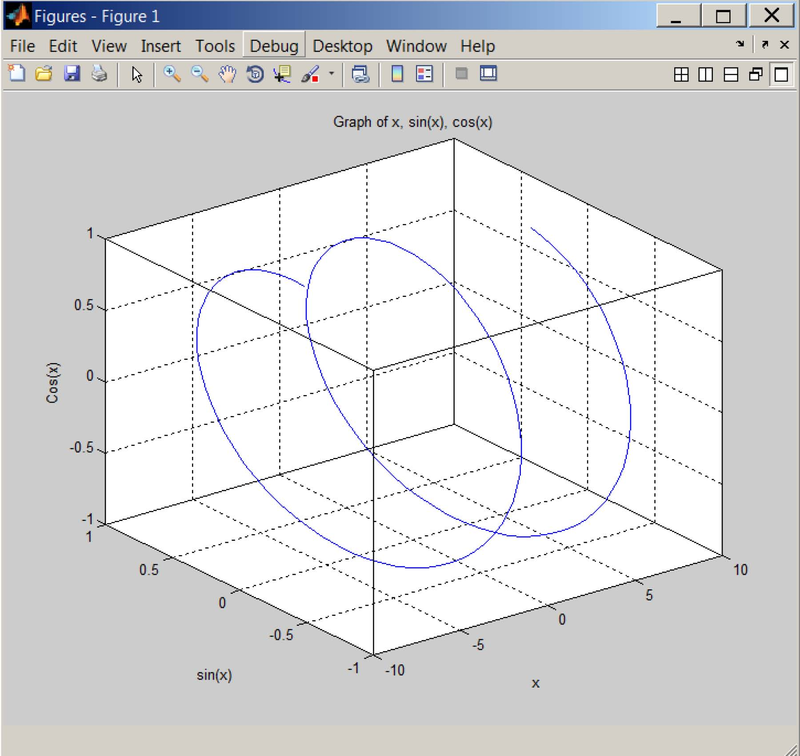
Figure 3.13 3D graph of x, sin(x), cos(x)
Use help or doc commands to learn more about 3D plots, for example, image(x), surf(x) and mesh(x).
- 2154 reads
