


Available under Creative Commons-ShareAlike 4.0 International License.
A code can be generated to reproduce the plots. To initialize this process, recall sinxcosx.fig and select File > Generate Code.
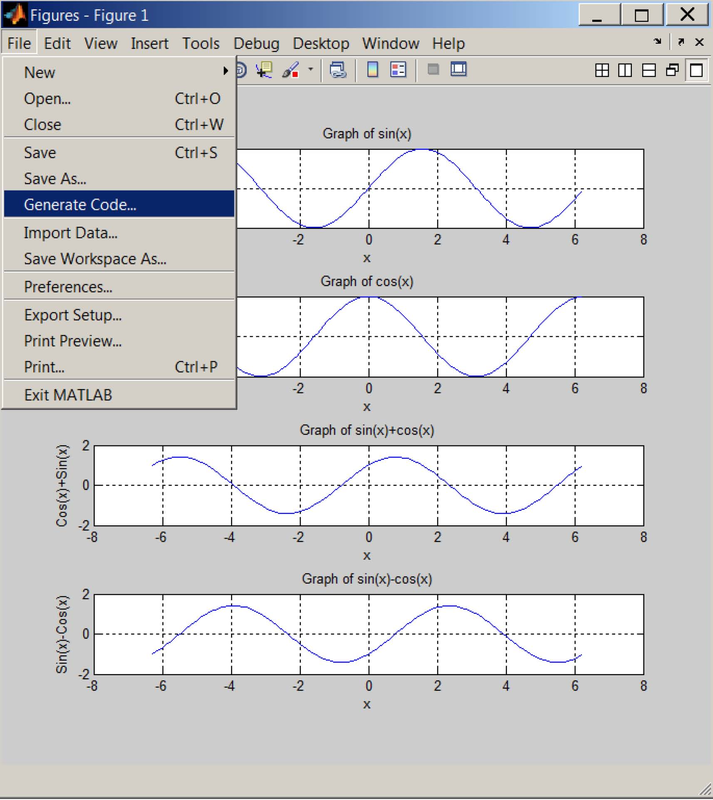
Figure 3.14 Generating code to reproduce a plot.
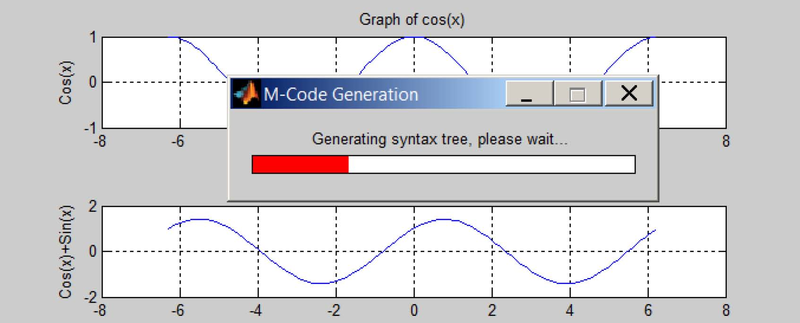
Figure 3.15 M-Code generation in progress.
    function createfigure2(X1, Y1, Y2, Y3, Y4)
%CREATEFIGURE2(X1,Y1,Y2,Y3,Y4)
% X1: vector of x data
% Y1: vector of y data
% Y2: vector of y data
% Y3: vector of y data
% Y4: vector of y data

% Auto-generated by MATLAB on 05-Oct-2011 12:43:49

% Create figure
figure1 = figure;

% Create axes
axes1 = axes('Parent',figure1,'YGrid','on','XGrid','on',...
    'Position',[0.13 0.791155913978495 0.775 0.11741935483871]);
box(axes1,'on');
hold(axes1,'all');

% Create title
title('Graph of sin(x)');

% Create xlabel
xlabel('x');
% Create ylabel
ylabel('Sin(x)');

% Create plot
plot(X1,Y1,'Parent',axes1,'DisplayName','Y1 vs X1');

% Create axes
axes2 = axes('Parent',figure1,'YGrid','on','XGrid','on',...
    'Position',[0.13 0.572069892473118 0.775 0.11741935483871]);
box(axes2,'on');
hold(axes2,'all');

% Create title
title('Graph of cos(x)');

% Create xlabel
xlabel('x');

% Create ylabel
ylabel('Cos(x)');

% Create plot
plot(X1,Y2,'Parent',axes2,'DisplayName','Y2 vs X1');

% Create axes
axes3 = axes('Parent',figure1,'YGrid','on','XGrid','on',...
    'Position',[0.13 0.352983870967742 0.775 0.11741935483871]);
box(axes3,'on');
hold(axes3,'all');

% Create title
title('Graph of sin(x)+cos(x)');

% Create xlabel
xlabel('x');

% Create ylabel
ylabel('Cos(x)+Sin(x)');

% Create plot
plot(X1,Y3,'Parent',axes3,'DisplayName','Y3 vs X1');

% Create axes
axes4 = axes('Parent',figure1,'YGrid','on','XGrid','on',...
    'Position',[0.13 0.133897849462366 0.775 0.11741935483871]);
box(axes4,'on');
hold(axes4,'all');

% Create title
title('Graph of sin(x)-cos(x)');

% Create xlabel
xlabel('x');

% Create ylabel
ylabel('Sin(x)-Cos(x)');

% Create plot
plot(X1,Y4,'Parent',axes4,'DisplayName','Y4 vs X1');
As you can see, the file assumes you are using the same variables originally used to create the graph, therefore the variables need to be passed as arguments in the future executions of the generated code.
- 2316 reads
