


Of course, price alone does not determine the quantity of a good or service that people consume. Coffee consumption, for example, will be affected by such variables as income and population. Preferences also play a role. The story at the beginning of the chapter illustrates as much. Starbucks “turned people on” to coffee. We also expect other prices to affect coffee consumption. People often eat doughnuts or bagels with their coffee, so a reduction in the price of doughnuts or bagels might induce people to drink more coffee. An alternative to coffee is tea, so a reduction in the price of tea might result in the consumption of more tea and less coffee. Thus, a change in any one of the variables held constant in constructing a demand schedule will change the quantities demanded at each price. The result will be a shift in the entire demand curve rather than a movement along the demand curve. A shift in a demand curve is called a change in demand.
Suppose, for example, that something happens to increase the quantity of coffee demanded at each price. Several events could produce such a change: an increase in incomes, an increase in population, or an increase in the price of tea would each be likely to increase the quantity of coffee demanded at each price. Any such change produces a new demand schedule. Figure 3.2 shows such a change in the demand schedule for coffee. We see that the quantity of coffee demanded per month is greater at each price than before. We show that graphically as a shift in the demand curve. The original curve, labeled D1, shifts to the right to D2. At a price of $6 per pound, for example, the quantity demanded rises from 25 million pounds per month (point A) to 35 million pounds per month (point A′).
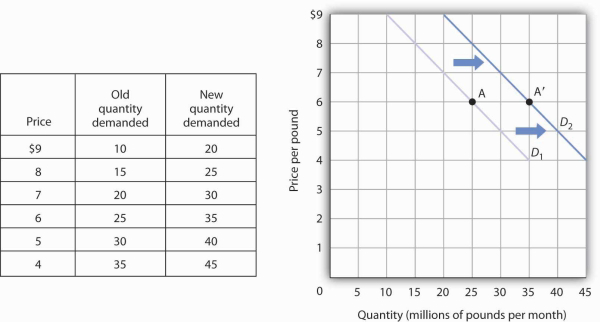
An increase in the quantity of a good or service demanded at each price is shown as an increase in demand. Here, the original demand curve D1 shifts to D2. Point A on D1 corresponds to a price of $6 per pound and a quantity demanded of 25 million pounds of coffee per month. On the new demand curveD2, the quantity demanded at this price rises to 35 million pounds of coffee per month (point A′).
Just as demand can increase, it can decrease. In the case of coffee, demand might fall as a result of events such as a reduction in population, a reduction in the price of tea, or a change in preferences. For example, a definitive finding that the caffeine in coffee contributes to heart disease, which is currently being debated in the scientific community, could change preferences and reduce the demand for coffee.
A reduction in the demand for coffee is illustrated in Figure 3.3. The demand schedule shows that less coffee is demanded at each price than in Figure 3.1. The result is a shift in demand from the original curve D1 to D3. The quantity of coffee demanded at a price of $6 per pound falls from 25 million pounds per month (point A) to 15 million pounds per month (point A″). Note, again, that a change in quantity demanded, ceteris paribus, refers to a movement along the demand curve, while a change in demand refers to a shift in the demand curve.
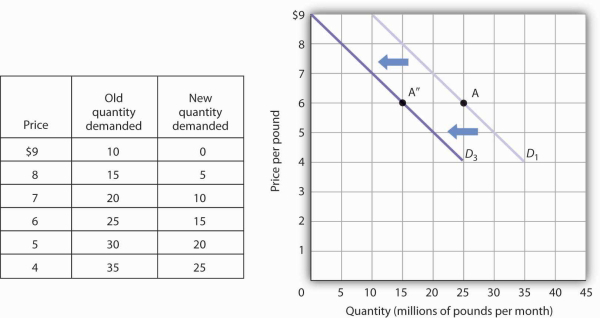
A reduction in demand occurs when the quantities of a good or service demanded fall at each price. Here, the demand schedule shows a lower quantity of coffee demanded at each price than we had in Figure 3.1. The reduction shifts the demand curve for coffee to D3 from D1. The quantity demanded at a price of $6 per pound, for example, falls from 25 million pounds per month (point A) to 15 million pounds of coffee per month (point A″).
A variable that can change the quantity of a good or service demanded at each price is called a demand shifter. When these other variables change, the all-other-things unchanged conditions behind the original demand curve no longer hold. Although different goods and services will have different demand shifters, the demand shifters are likely to include (1) consumer preferences, (2) the prices of related goods and services, (3) income, (4) demographic characteristics, and (5) buyer expectations. Next we look at each of these.
- 2371 reads
