


To study losses propagation and to show how these dynamics affect OEE in a complex system1 this chapter presents some examples taken from an OEE study of a real manufacturing system carried out by the authors through a process simulation analysis2.
Simulation is run for each kind of time losses (Availability, Performance and Quality), to clearly show how each equipment ineffectiveness may compromise the performance of the whole system.
The simulation model is about a manufacturing plant for production of electrical cable. In particular we focuses on production of unipolar electrical cable that takes place by a flow-shop process. In the floor plant the production equipment is grouped in production areas arranged according to their functions (process layout). The different production areas are located along the line of product flow (product layout). Buffers are present amongst the production areas to stock the product in process. This particular plant allows to analyze deeply the problem of OEE-OTE investigation due to its complexity.
In terms of layout the production system was realized as a job shop system, although the flow of material from a station to another was continuous and typical of flow shop process. As stated in (§2) the reason lies on due to the huge size of the products that passes from a station to another. For this reason the buffer amid station, although present, couldn’t contain huge amount of material.
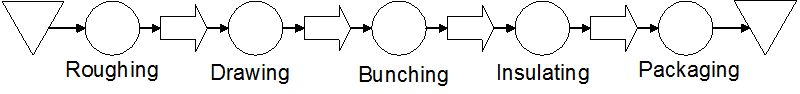
The process implemented in the simulation model is shown in Figure 3.14. Entities are unit quantity of cable that have different mass amongst stations. Parameters that are data input in the model are equipment speed, defectiveness, equipment failure rate and mean time to repair. Each parameters is described by a statistical distribution in order to simulate random condition. In particular equipment speed has been simulated with a triangular distribution in order to simulate performance losses due to speed reduction.
The model evaluates OTE and OEE for each station as usually measured in manufacturing plant. The model has been validated through a plan of tests and its results of OEE has been compared with results obtained from an analytic evaluation.
- 2033 reads
