


Available under Creative Commons-ShareAlike 4.0 International License. Download for free at http://cnx.org/contents/5b6e61df-b830-48cb-9764-94696cb47c80@1.3
The Waveform Graph allows numeric arrays to be displayed graphically in the Front Panel window. Similar to the previous example, we will build a simple G program that will allow you to graph a sine wave using the equation:
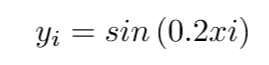
Figure 7.15
for i = 0,1,2, ... , 99.
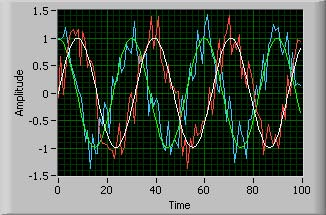
Figure 7.16 Waveform Graph
- 2096 reads
