


The heart of interactive programming in G is the while loop. Any input control within the while loop can be modified from the Front Panel window at run time to provide seamless interaction with the G program.
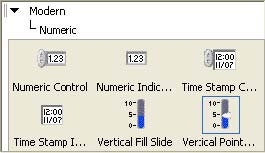
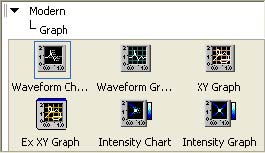
In the Front Panel window, from the Functions »Modern »Numeric select the vertical pointer slide. From the Functions »Modern »Graph select Waveform Chart.
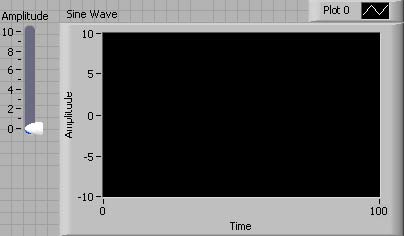
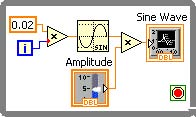
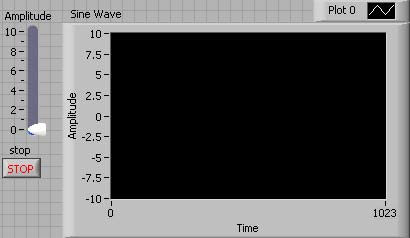
Re-label the vertical pointer slide as Amplitude and the waveform chart as Sine Wave. Re-arrange to GUI to look like the figure below.
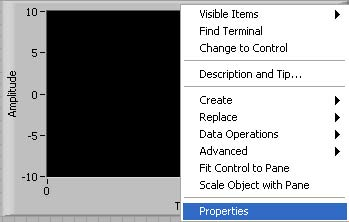
Right click on Sine Wave and select Properties from the pop-up menu.
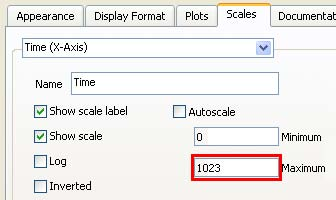
Select the Scales tab and change Maximum to 1023. Sine Wave will display 1024 samples.
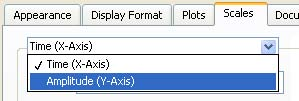
Click on the down arrow located to the right of Time (XAxis) and select Amplitude (YAxis).
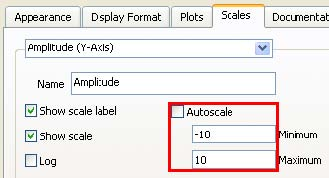
De-selectAutoscale and change the Minimum and Maximum values to-10 and 10. ClickOK.
Rearrange Amplitude and Sine Wave terminals and finish the program as shown in Figure Figure 8.9. Scroll the mouse pointer over the Loop Control...
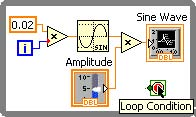
And right click on the Loop Control and from the pop-up menu select Create Control. A stop terminal is created.
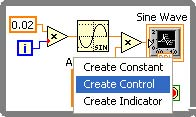
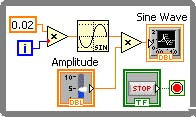
With the corresponding stop Boolean input control. Save the G program asInteractivity.vi.
Run the G program.
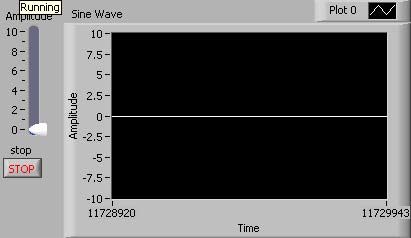
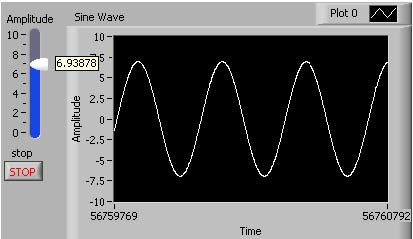
While the program is running, change the Amplitude and watch the graph update to reflect the interactive changes.
To end the G program, simply click on the stop button.
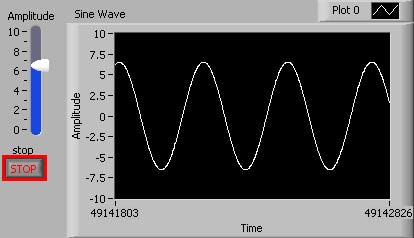
Congratulations. You have successfully completed and executed your first interactive G program.
- 2104 reads
