


According to Figure 1.9 and Figure 1.10 were analyzed the losses regarding NVAA and Insaturation. In fact were analyzed all 4 critical workstations (because they have the worst losses) and were identified 41 types of non-value-added activities (walking, waiting, turning, picking....) in the various sub-phases of the production process. In Table 1.4 is shown some examples of non-value-added activities analyzed (MUDA Analysis).
Some examples of standard tools used to analyze NVAA reduction (MUDA Analysis) for the 4 workstations are shown here below in Figure 1.10, Figure 1.11 and Figure 1.12) job stratification (VAA - Value Added Activities; NVAA – Non-Value-Added Activities; LBL - Low Balancing Level; EAWS - European Assembly Work Sheet – Ergonomy); 2) Spaghetti Chart and 3) Kaizen Standard.
|
N° |
Losses identified |
Solution |
Non-value-added activities identified |
|
|---|---|---|---|---|
|
1 |
Pick picking list for sequencing |
Complete hub sequencing |
To pick |
|
|
2 |
Pick the box for sequencing |
Complete hub sequencing |
To pick |
|
|
3 |
Select sheets for the different model |
Unification of the sheets from 3 to 1 |
To select |
|
|
4 |
Pick sheets for the different process |
Unification of the sheets from 3 to 1 |
To pick |
|
|
5 |
Pick identification sheet |
Unification of the sheets from 3 to 1 |
To pick |
|
|
6 |
Go to the printer to pick up sticker |
Print sticker |
To walk |
|
|
7 |
Pick identification hub label |
Digital label with barcode |
To pick |
|
|
8 |
Throw liner nameplate into the waste container |
Print labels directly onto sheet unified |
To trow |
|
|
9 |
Pick equipment for reading labels coupling |
Automatic reading |
To pick |
|
|
10 |
Combination of manual pallet |
Automatic combination |
To check |
|
|
11 |
Use of a single box |
Enabling a second workstation |
To walk |
|
|
12 |
Pick hub |
Pick subgroup (hub+ damper |
To pick |
|
|
13 |
Use of electrical equipment through keyboard |
New air equipment without keyboard |
To arrange |
|
|
14 |
Use of air equipment through keyboard |
New air equipment without keyboard |
To wait |
|
|
15 |
Transport empty box hub sequencing to put the full box |
Complete hub sequencing |
To transport |
|
|
16 |
Walk to the line side to pick damper |
Complete hub sequencing |
To walk |
|
|
17 |
Remove the small parts to pair with damper |
Complete hub sequencing |
To pick |
|
|
18 |
Transport empty box damper sequencing to put the full box |
Complete damper sequencing |
To transport |
|
|
19 |
Pick the hub and put on the line |
Pick subgroup (hub+ damper) |
To pick |
|
|
20 |
Select the work program for the next workstation |
Select the work program |
To select |
|
|
21 |
Press the feed button for the damper |
Use a single workstation after the sequencing of the subgroup in order to press a button once |
To push |
|
|
22 |
Wait for the translational motion of the pallet |
Use a single workstation after the sequencing of the subgroup and match processing activities during the translation of the pallet |
To wait |
|


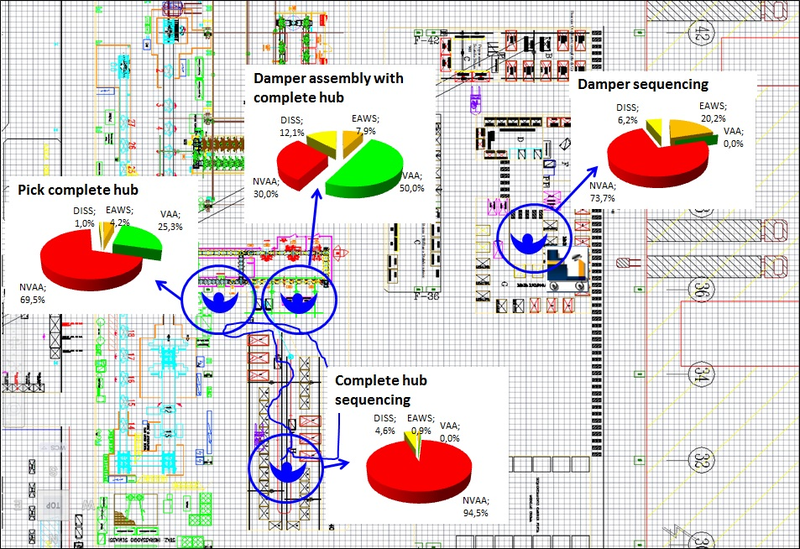
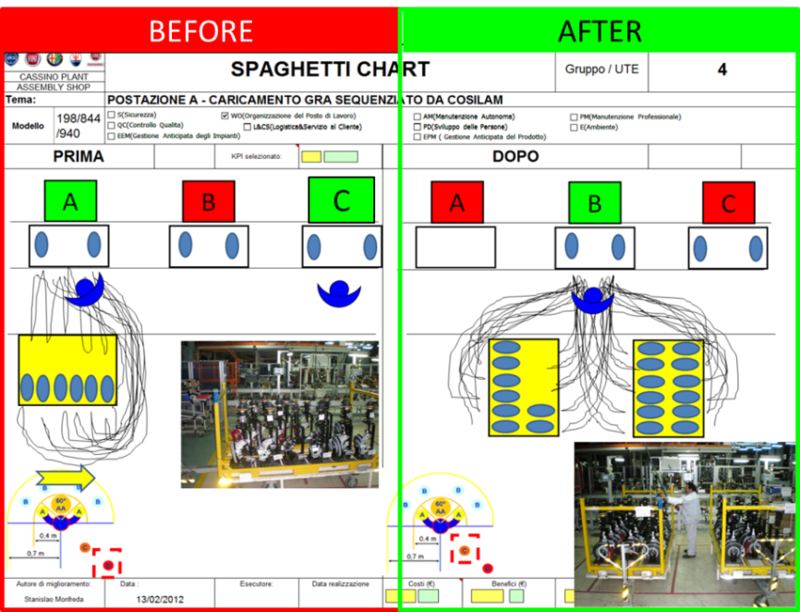
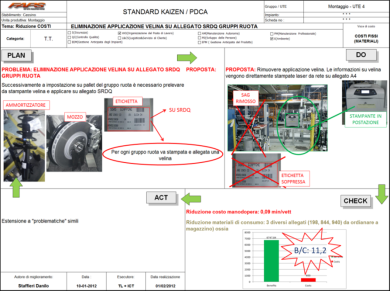
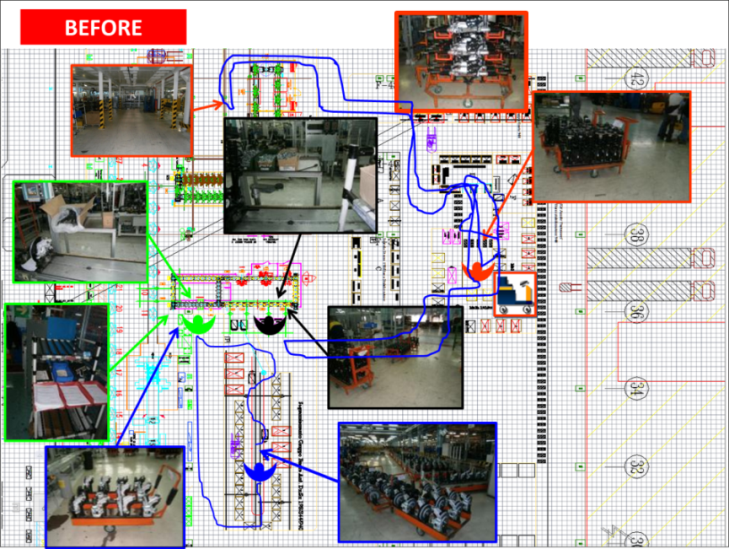
Figure 1.13 shows the initial scenario analyzed to identify problems and weaknesses.
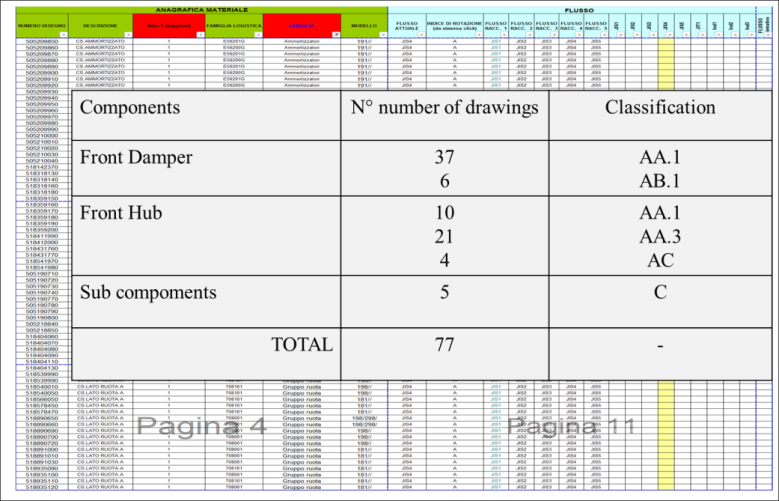
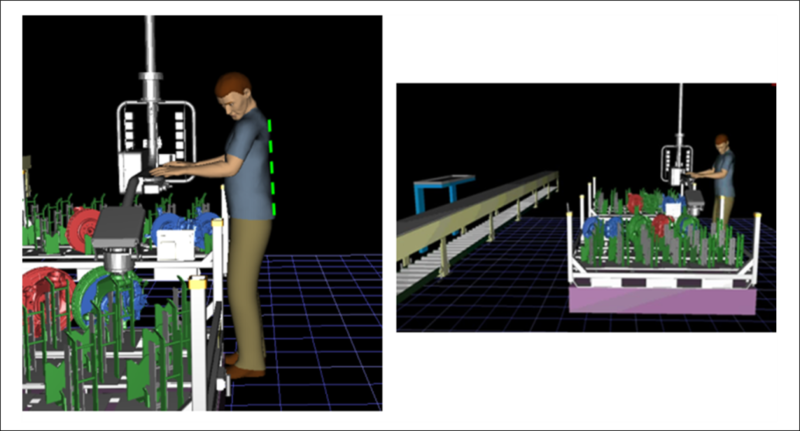
At this point was assumed the new flow of the complete damper (corner) = damper + complete hub sequencing according to the material matrix considering losses relating to handling (material matrix classification – see Figure 1.14). The material matrix classifies the commodities (number of drawings) in three main groups: A (bulky, multi-variations, expensive), B (normal) and C (small parts) and subgroups (a mixture of group A: bulky and multi-variations or bulky and expensive etc.). For each of these groups was filled out the flow matrix that defines the correct flow associated: JIS (and different levels), JIT (and different levels) and indirect (and different levels). After identifying the correct flow, in the JIS case, was built a prototype of the box (bin) to feed the line that would ensure the right number of parts to optimize logistic handling. However, the new box (bin) for this new mechanical subgroup must feed the line in a comfortable and ergonomic manner for the worker in the workstation, for this reason was simulated the solution before the realization of the box (bin) (see Figure 1.15).
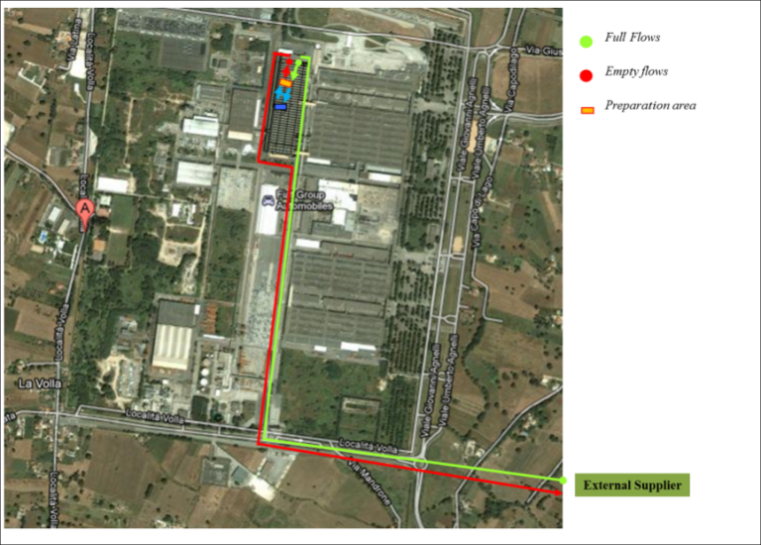
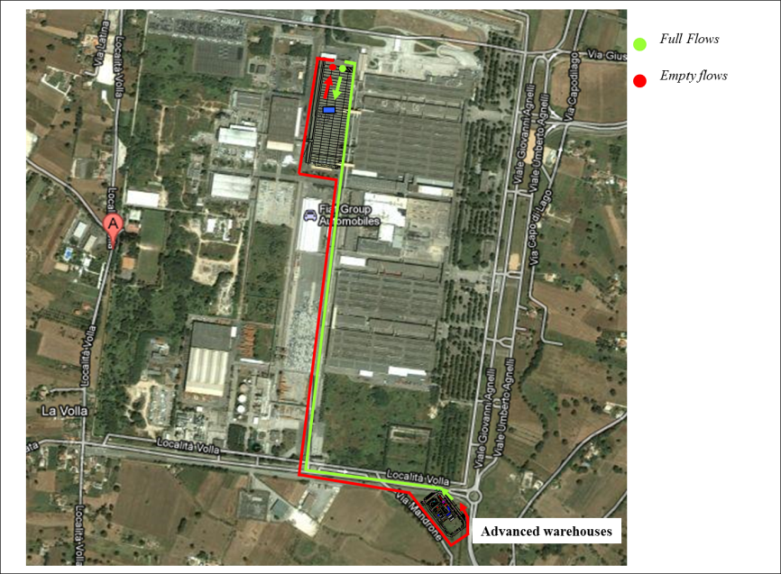
At the end of the Muda analysis (NVAA analysis) were applied all the solutions found to have a lean process (the internal target is to achieve 25% of average NVAA losses) and was reorganized the line through a new line balancing level (rebalancing) to achieve 5% of the average line balancing losses (internal target). Another important aspect was the logistics flows analysis (see Figure 1.16) considering advanced warehouses ( Figure 1.17). The simulation scenario was defined using trucks from the Cassino plant warehouses that also feed other commodities to achieve high levels of saturation to minimize handling losses.
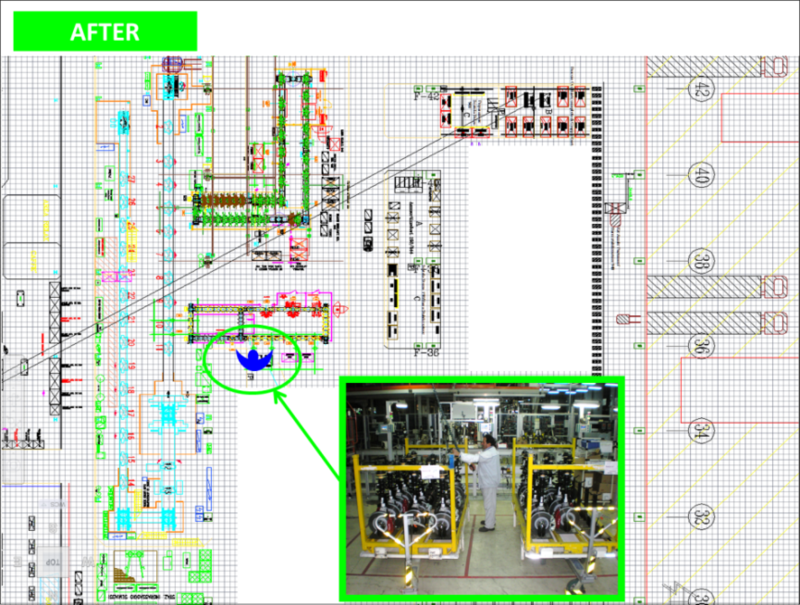
At the end of the handling analysis (flow, stock level…) thanks to this new “lean” organization of material matrix was used the correct line feed from the Just In Sequence warehouse. It was reduced the internal warehouse (stock level), the space used for sequencing (square metres), the indirect manpower used to feed the sequencing area and we obtained zero forklifts on the shopfloor because we used the ro-ro (roll in - roll out) system. Figure 1.18 shows the final scenario in which we have 1 operator instead of 4 operators.
- 4786 reads
