


A rotation of a curve occurs when we change its slope, with one point on the curve fixed. Suppose, for example, the ski club changes the price of its bus rides to the ski area to $30 per trip, and the payment from the student government remains $200 for each day the trip is available. This means the club’s revenues will remain $200 if it has no passengers on a particular trip. Revenue will, however, be different when the club has passengers. Because the slope of our revenue curve equals the price per ticket, the slope of the revenue curve changes.
Panel (a) of Figure 20.10 shows what happens to the original revenue curve, R1, when the price per ticket is raised. Point A does not change; the club’s revenue with zero passengers is unchanged. But with 10 passengers, the club’s revenue would rise from $300 (point B on R1) to $500 (point B′ on R4). With 20 passengers, the club’s revenue will now equal $800 (point C′ on R4).
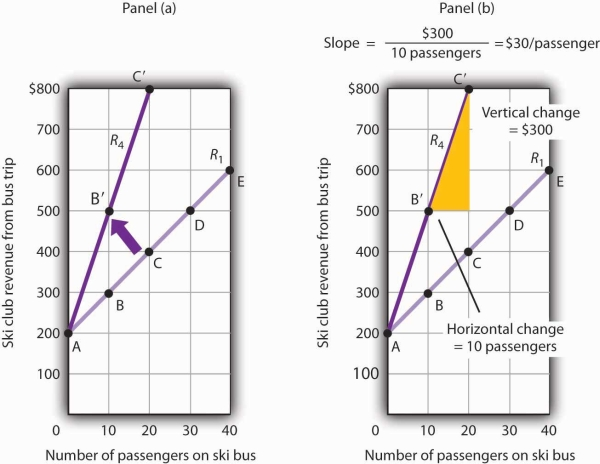
A curve is said to rotate when a single point remains fixed while other points on the curve move; a rotation always changes the slope of a curve. Here an increase in the price per passenger to $30 would rotate the revenue curve from R1 to R4 in Panel (a). The slope of R4 is $30 per passenger.
The new revenue curve R4 is steeper than the original curve. Panel (b) shows the computation of the slope of the new curve between points B′ and C′. The slope increases to $30 per passenger—the new price of a ticket. The greater the slope of a positively sloped curve, the steeper it will be.
We have now seen how to draw a graph of a curve, how to compute its slope, and how to shift and rotate a curve. We have examined both positive and negative relationships. Our work so far has been with linear relationships. Next we will turn to nonlinear ones.
KEY TAKEAWAYS
- A graph shows a relationship between two or more variables.
- An upward-sloping curve suggests a positive relationship between two variables. A downward-sloping curve suggests a negative relationship between two variables.
- The slope of a curve is the ratio of the vertical change to the horizontal change between two points on the curve. A curve whose slope is constant suggests a linear relationship between two variables.
- A change from one point on the curve to another produces a movement along the curve in the graph. A shift in the curve implies new values of one variable at each value of the other variable. A rotation in the curve implies that one point remains fixed while the slope of the curve changes.
TRY IT!
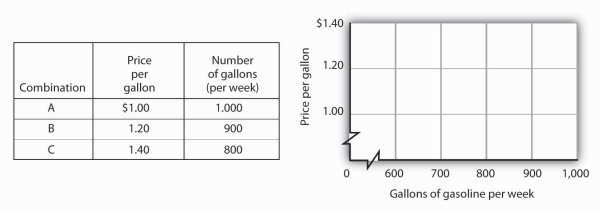
The following table shows the relationship between the number of gallons of gasoline people in a community are willing and able to buy per week and the price per gallon. Plot these points in
the grid provided and label each point with the letter associated with the combination. Notice that there are breaks in both the vertical and horizontal axes of the grid. Draw a line through
the points you have plotted. Does your graph suggest a positive or a negative relationship? What is the slope between A and B? Between B and C? Between A and C? Is the relationship
linear?
Now suppose you are given the following information about the relationship between price per gallon and the number of gallons per week gas stations in the community are willing to sell.
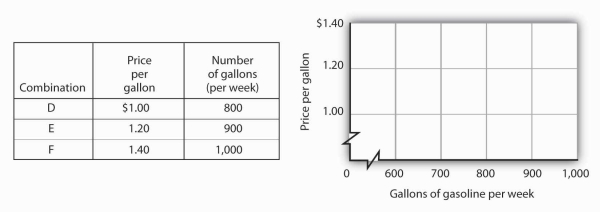
Plot these points in the grid provided and draw a curve through the points you have drawn. Does your graph suggest a positive or a negative relationship? What is the slope between D and E? Between E and F? Between D and F? Is this relationship linear?
ANSWER TO TRY IT!
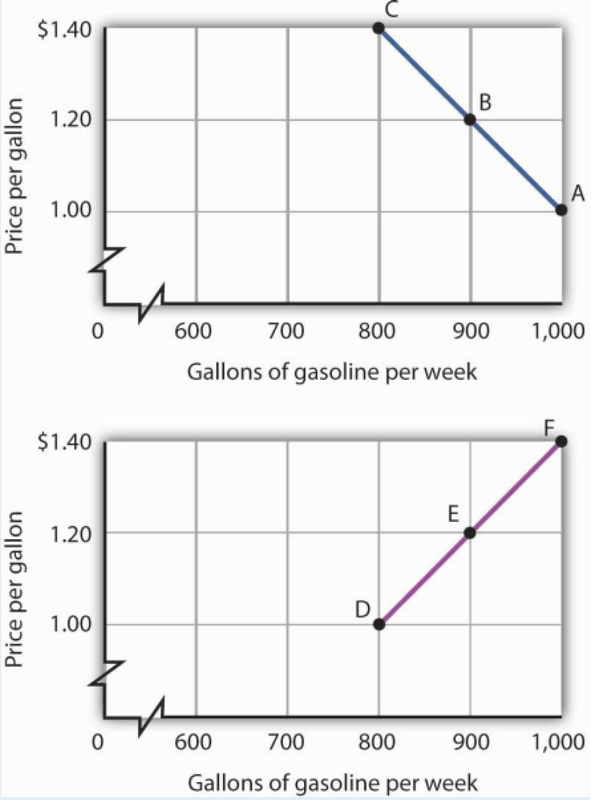
Here is the first graph. The curve’s downward slope tells us there is a negative relationship between price and the quantity of gasoline people are willing and able to buy. This curve, by the way, is a demand curve (the next one is a supply curve). We will study demand and supply soon; you will be using these curves a great deal. The slope between A and B is −0.002 (slope = vertical change/horizontal change = −0.20/100).The slope between B and C and between A and C is the same. That tells us the curve is linear, which, of course, we can see—it is a straight line.
Here is the supply curve. Its upward slope tells us there is a positive relationship between price per gallon and the number of gallons per week gas stations are willing to sell. The slope between D and E is 0.002(slope equals vertical change/horizontal change = 0.20/100). Because the curve is linear, the slope is the same between any two points, for example, between E and F and between D and F.
- 2789 reads
