


A negative relationship is one in which two variables move in opposite directions. A negative relationship is sometimes called an inverse relationship. The slope of a curve describing a negative relationship is always negative. A curve with a negative slope is always downward sloping.
As an example of a graph of a negative relationship, let us look at the impact of the cancellation of games by the National Basketball Association during the 1998–1999 labor dispute on the earnings of one player: Shaquille O’Neal. During the 1998–1999 season, O’Neal was the center for the Los Angeles Lakers.
O’Neal’s salary with the Lakers in 1998–1999 would have been about $17,220,000 had the 82 scheduled games of the regular season been played. But a contract dispute between owners and players resulted in the cancellation of 32 games. Mr. O’Neal’s salary worked out to roughly $210,000 per game, so the labor dispute cost him well over $6 million. Presumably, he was able to eke out a living on his lower income, but the cancellation of games cost him a great deal.
We show the relationship between the number of games canceled and O’Neal’s 1998– 1999 basketball earnings graphically in Figure 20.7. Canceling games reduced his earnings, so the number of games canceled is the independent variable and goes on the horizontal axis. O’Neal’s earnings are the dependent variable and go on the vertical axis. The graph assumes that his earnings would have been $17,220,000 had no games been canceled (point A, the vertical intercept). Assuming that his earnings fell by $210,000 per game canceled, his earnings for the season were reduced to $10,500,000 by the cancellation of 32 games (point B). We can draw a line between these two points to show the relationship between games canceled and O’Neal’s 1998–1999 earnings from basketball. In this graph, we have inserted a break in the vertical axis near the origin. This allows us to expand the scale of the axis over the range from $10,000,000 to $18,000,000. It also prevents a large blank space between the origin and an income of $10,500,000—there are no values below this amount.
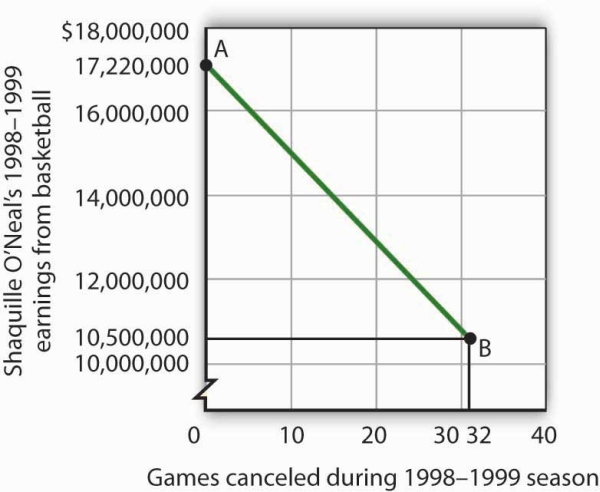
If no games had been canceled during the 1998–1999 basketball season, Shaquille O’Neal would have earned $17,220,000 (point A). Assuming that his salary for the season fell by $210,000 for each game canceled, the cancellation of 32 games during the dispute between NBA players and owners reduced O’Neal’s earnings to $10,500,000 (point B).
What is the slope of the curve in Figure 20.7? We have data for two points, A and B. At A, O’Neal’s basketball salary would have been $17,220,000. At B, it is $10,500,000. The vertical change between points A and B equals -$6,720,000. The change in the horizontal axis is from zero games canceled at A to 32 games canceled at B. The slope is thus
Slope=vertical changehorizontal change=−$6,720,00032 games=−$210,000/game
Notice that this time the slope is negative, hence the downward-sloping curve. As we travel down and to the right along the curve, the number of games canceled rises and O’Neal’s salary falls. In this case, the slope tells us the rate at which O’Neal lost income as games were canceled.
The slope of O’Neal’s salary curve is also constant. That means there was a linear relationship between games canceled and his 1998–1999 basketball earnings.
- 7813 reads
