


The market demand curves we studied in previous chapters are derived from individual demand curves such as the one depicted in Figure 7.2. Suppose that in addition to Ms. Andrews, there are two other consumers in the market for apples—Ellen Smith and Koy Keino. The quantities each consumes at various prices are given in Figure 7.4, along with the quantities that Ms. Andrews consumes at each price. The demand curves for each are shown in Panel (a). The market demand curve for all three consumers, shown in Panel (b), is then found by adding the quantities demanded at each price for all three consumers. At a price of $2 per pound, for example, Ms. Andrews demands 5 pounds of apples per month, Ms. Smith demands 3 pounds, and Mr. Keino demands 8 pounds. A total of 16 pounds of apples are demanded per month at this price. Adding the individual quantities demanded at $1 per pound yields market demand of 40 pounds per month. This method of adding amounts along the horizontal axis of a graph is referred to as summing horizontally. The market demand curve is thus the horizontal summation of all the individual demand curves.
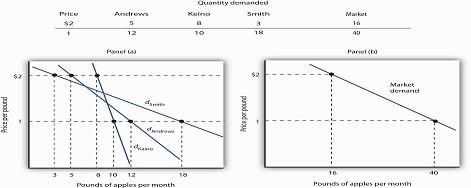
The demand schedules for Mary Andrews, Ellen Smith, and Koy Keino are given in the table. Their individual demand curves are plotted in Panel (a). The market demand curve for all three is shown in Panel (b).
Individual demand curves, then, reflect utility-maximizing adjustment by consumers to various market prices. Once again, we see that as the price falls, consumers tend to buy more of a good. Demand curves are downward-sloping as the law of demand asserts.
- 2592 reads
