


Net exports affect both the slope and the position of the aggregate demand curve. A change in the price level causes a change in net exports that moves the economy along its aggregate demand curve. This is the international trade effect. A change in net exports produced by one of the other determinants of net exports listed above (incomes and price levels in other nations, the exchange rate, trade policies, and preferences and technology) will shift the aggregate demand curve. The magnitude of this shift equals the change in net exports times the multiplier, as shown in Figure 30.3. Panel (a) shows an increase in net exports; Panel (b) shows a reduction. In both cases, the aggregate demand curve shifts by the multiplier times the initial change in net exports, provided there is no other change in the other components of aggregate demand.
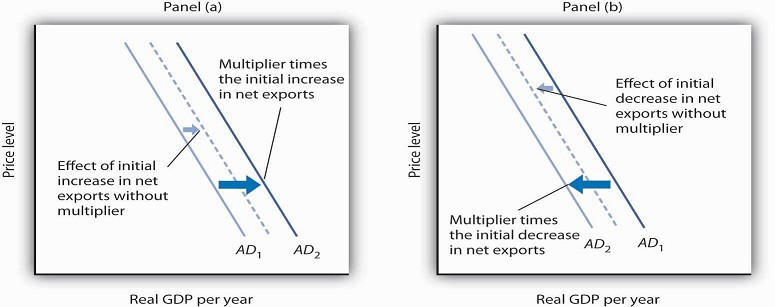
In Panel (a), an increase in net exports shifts the aggregate demand curve to the right by an amount equal to the multiplier times the initial change in net exports. In Panel (b), an equal eduction in net exports shifts the aggregate demand curve to the left by the same amount.
Changes in net exports that shift the aggregate demand curve can have a significant impact on the economy. The United States, for example, experienced a slowdown in the rate of increase in real GDP in the second and third quarters of 1998—virtually all of this slowing was the result of a reduction in net exports caused by recessions that staggered economies throughout Asia. The Asian slide reduced incomes there and thus reduced Asian demand for U.S. goods and services. We will see in the next section another mechanism through which difficulties in other nations can cause changes in a nation’s net exports and its level of real GDP in the short run.
KEY TAKEAWAYS
- International trade allows the world’s resources to be allocated on the basis of comparative advantage and thus allows the production of a larger quantity of goods and services than would be available without trade.
- Trade affects neither the economy’s natural level of employment nor its real wage in the long run; those are determined by the demand for and the supply curve of labor.
- Growth in international trade has outpaced growth in world output over the past five decades.
- The chief determinants of net exports are domestic and foreign incomes, relative price levels, exchange rates, domestic and foreign trade policies, and preferences and technology.
- A change in the price level causes a change in net exports that moves the economy along its aggregate demand curve. This is the international trade effect. A change in net exports produced by one of the other determinants of net exports will shift the aggregate demand curve by an amount equal to the initial change in net exports times the multiplier.
TRY IT!
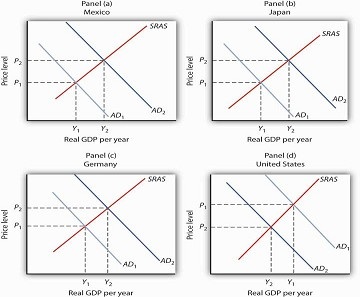
Draw graphs showing the aggregate demand and short-run aggregate supply curves in each of four countries: Mexico, Japan, Germany, and the United States. Assume that each country is initially in equilibrium with a real GDP of Y1 and a price level of P1. Now show how each of the following four events would affect aggregate demand, the price level, and real GDP in the country indicated.
- The United States is the largest foreign purchaser of goods and services from Mexico. How does an expansion in the United States affect real GDP and the price level in Mexico?
- Japan’s exchange rate falls sharply. How does this affect the price level and real GDP in Japan?
- A wave of pro-German sentiment sweeps France, and the French sharply increase their purchases of German goods and services. How does this affect real GDP and the price level in Germany?
- Canada, the largest importer of U.S. goods and services, slips into a recession. How does this affect the price level and real GDP in the United States?
Case in Point: Canadian Net Exports Survive the Loonie’s Rise
Throughout 2003 and the first half of 2004, the Canadian dollar, nicknamed the loonie after the Canadian bird that is featured on its one-dollar coin, rose sharply in value against the U.S.
dollar. Because the United States and Canada are major trading partners, the changing exchange rate suggested that, other things equal, Canadian exports to the United States would fall and
imports rise. The resulting fall in net exports, other things equal, could slow the rate of growth in Canadian GDP.
Fortunately for Canada, “all other things” were not equal. In particular, strong income growth in the United States and China increased the demand for Canadian exports. In addition, the
loonie’s appreciation against other currencies was less dramatic, and so Canadian exports remained competitive in those markets. While imports did increase, as expected due to the exchange
rate change, exports grew at a faster rate, and hence net exports increased over the period.
In sum, Canadian net exports grew, although not by as much as they would have had the loonie not appreciated. As Beata Caranci, an economist for Toronto Dominion Bank put it, “We might have
some bumpy months ahead but it definitely looks like the worst is over. … While Canadian exports appear to have survived the loonie’s run-up, their fortunes would be much brighter if the
exchange rate were still at 65 cents.”
Source: Steven Theobald, “Exports Surviving Loonie’s Rise: Study,” Toronto Star, July 13, 2004, p. D1.
ANSWER TO TRY IT! PROBLEMS
- Mexico’s exports increase, shifting its aggregate demand curve to the right. Mexico’s real GDP and price level rise, as shown in Panel (a).
- Japan’s net exports rise. This event shifts Japan’s aggregate demand curve to the right, increasing its real GDP and price level, as shown in Panel (b).
- Germany’s net exports increase, shifting Germany’s aggregate demand curve to the right, increasing its price level and real GDP, as shown in Panel (c).
- U.S. exports fall, shifting the U.S. aggregate demand curve to the left, which will reduce the price level and real GDP, as shown in Panel (d).
- 31813 reads
