


Learning Objectives
- Discuss and illustrate government responses to the market failures of public goods, external costs and benefits, and imperfect competition and how these responses have the potential to reduce deadweight loss.
- Define merit and demerit goods and explain why government may intervene to affect the quantities consumed.
- Discuss ways in which governments redistribute income.
What do we want from our government? One answer is that we want a great deal more than we did several decades ago. The role of government has expanded dramatically in the last 75+ years. In 1929 (the year the Commerce Department began keeping annual data on macroeconomic performance in the United States), government expenditures at all levels (state, local, and federal) were less than 10% of government expenditures all spending by government agencies.government revenues All funds received by government agencies. government purchases Goods or services purchased by a government agency.transfer payments Payments made by government agencies to individuals in the form of grants rather than in return for labor or other services. the nation’s total output, which is called gross domestic product (GDP). In the current century, that share has more than tripled. Total government spending per capita, adjusted for inflation, has increased more than six fold since 1929.
Figure 15.1 shows total government expenditures and revenues as a percentage of GDP from 1929 to 2007. All levels of government are included. Government expenditures include all spending by government agencies. Government revenues include all funds received by government agencies. The primary component of government revenues is taxes; revenue also includes miscellaneous receipts from fees, fines, and other sources. We will look at types of government revenues and expenditures later in this chapter.
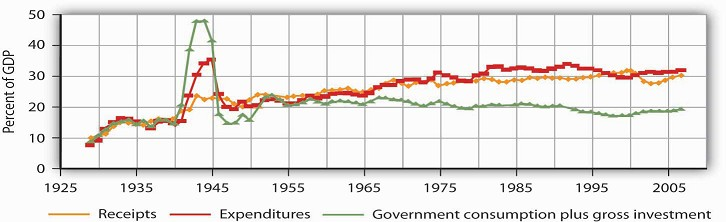
Government expenditures and revenues have risen dramatically as a percentage of GDP, the most widely used measure of economic activity.
Source: U.S. Department of Commerce, Bureau of Economic Analysis, NIPA Tables 1.15 and 3.1.
Figure 15.1 also shows government purchases as a percentage of GDP. Government purchases happen when a government agency purchases or produces a good or a service. We measure government purchases to suggest the opportunity cost of government. Whether a government agency purchases a good or service or produces it, factors of production are being used for public sector, rather than private sector, activities. A city police department’s purchase of new cars is an example of a government purchase. Spending for public education is another example.
Government expenditures and purchases are not equal because much government spending is not for the purchase of goods and services. The primary source of the gap is transfer payments, payments made by government agencies to individuals in the form of grants rather than in return for labor or other services. Transfer payments represent government expenditures but not government purchases. Governments engage in transfer payments in order to redistribute income from one group to another. The various welfare programs for low-income people are examples of transfer payments. Social Security is the largest transfer payment program in the United States. This program transfers income from people who are working (by taxing their pay) to people who have retired. Interest payments on government debt, which are also a form of expenditure, are another example of an expenditure that is not counted as a government purchase.
Several points about Figure 15.1 bear special attention. Note first the path of government purchases. Government purchases relative to GDP rose dramatically during World War II, then dropped back to about their prewar level almost immediately afterward. Government purchases rose again, though less sharply, during the Korean War. This time, however, they did not drop back very far after the war. It was during this period that military spending rose to meet the challenge posed by the former Soviet Union and other communist states—the “Cold War.” Government purchases have ranged between 15 and 20% of GDP ever since. The Vietnam War, the Persian Gulf War, and the wars in Afghanistan and Iraq did not have the impact on purchases that characterized World War II or even the Korean War. A second development, the widening gap between expenditures and purchases, has occurred since the 1960s. This reflects the growth of federal transfer programs, principally Social Security, programs to help people pay for health-care costs, and aid to low-income people. We will discuss these programs later in this chapter.
Finally, note the relationship between expenditures and receipts. When a government’s revenues equal its expenditures for a particular period, it has a balanced budget. A budget surplus occurs if a government’s revenues exceed its expenditures, while a budget deficit exists if government expenditures exceed revenues.
Prior to 1980, revenues roughly matched expenditures for the public sector as a whole, except during World War II. But expenditures remained consistently higher than revenues between 1980 and 1996. The federal government generated very large deficits during this period, deficits that exceeded surpluses that typically occur at the state and local levels of government. The largest increases in spending came from Social Security and increased health-care spending at the federal level. Efforts by the federal government to reduce and ultimately eliminate its deficit, together with surpluses among state and local governments, put the combined budget for the public sector in surplus beginning in 1997. As of 1999, the Congressional Budget Office was predicting that increased federal revenues produced by a growing economy would continue to produce budget surpluses well into the twenty-first century.
That rather rosy forecast was set aside after September 11, 2001. Terrorist attacks on the United States and later on several other countries led to sharp and sustained increases in federal spending for wars in Afghanistan and Iraq, as well as expenditures for Homeland Security. The administration of George W. Bush proposed, and Congress approved, a tax cut. The combination of increased spending on the abovementioned items and others, as well as tax cuts, produced substantial deficits.
The evidence presented in Figure 15.1 does not fully capture the rise in demand for public sector services. In addition to governments that spend more, people in the United States have clearly chosen governments that do more. The scope of regulatory activity conducted by governments at all levels, for example, has risen sharply in the last several decades. Regulations designed to prevent discrimination, to protect consumers, and to protect the environment are all part of the response to a rising demand for public services, as are federal programs in health care and education.
Figure 15.2 summarizes the main revenue sources and types of expenditures for the U.S. federal government and for the European Union. In the United States, most revenues came from personal income taxes and from payroll taxes. Most expenditures were for transfer payments to individuals. Federal purchases were primarily for national defense; the “other purchases” category includes things such as spending for transportation projects and for the space program. Interest payments on the national debt and grants by the federal government to state and local governments were the other major expenditures. The situation in the European Union differs primarily by the fact that a greater share of revenue comes from taxes on production and imports and substantially less is spent on defense.
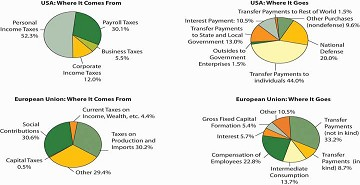
The four panels show the sources of government revenues and the shares of expenditures on various activities for all levels of government in the United States and the European Union in 2007.
To understand the role of government, it will be useful to distinguish four broad types of government involvement in the economy. First, the government attempts to respond to market failures to allocate resources efficiently. In a particular market, efficiency means that the quantity produced is determined by the intersection of a demand curve that reflects all the benefits of consuming a particular good or service and a supply curve that reflects the opportunity costs of producing it. Second, government agencies act to encourage or discourage the consumption of certain goods and services. The prohibition of drugs such as heroin and cocaine is an example of government seeking to discourage consumption of these drugs. Third, the government redistributes income through programs such as welfare and Social Security. Fourth, the government can use its spending and tax policies to influence the level of economic activity and the price level.
We will examine the first three of these aspects of government involvement in the economy in this chapter. The fourth, efforts to influence the level of economic activity and the price level, fall within the province of macroeconomics.
- 3858 reads
