


The national debt is the sum of all past federal deficits, minus any surpluses. Figure 27.6 shows the national debt as a percentage of GDP. It suggests that, relative to the level of economic activity, the debt is well below the levels reached during World War II. The ratio of debt to GDP rose from 1981 to 1996 and fell in the last years of the 20th century; it began rising again in 2002.
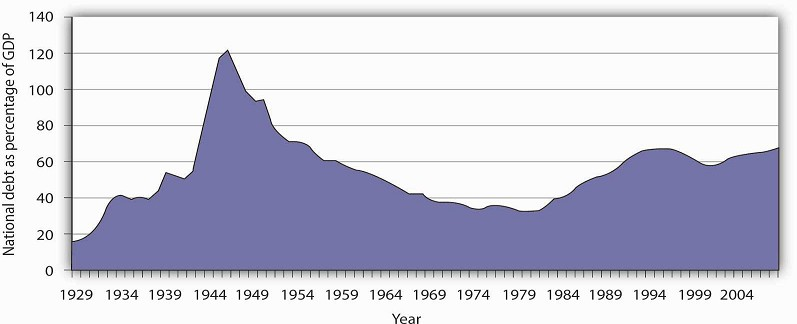
Sources: Data for 1929–1938 from Historical Statistics of the United States, Colonial Times to 1957— not strictly comparable with later data. Data for remaining years from Office of Management and Budget, Budget of the United States Government, Fiscal Year 2009, Historical Tables.
Judged by international standards, the U.S. national debt relative to its GDP is about average among developed nations. Table 27.1 below shows national debt as a percentage of GDP for 26 countries in 2006. It also shows deficits or surpluses as a percentage of GDP.
The chart shows national debt as a percentage of GDP and deficits or surpluses as a percentage of GDP in 2006. The national debt of the United States relative to its GDP was about average among these nations.
|
Country |
National debt as percentage of GDP |
Deficit (-) or surplus as percentage of GDP |
|---|---|---|
|
Japan |
179.7 |
−2.9 |
|
Italy |
118.7 |
−4.5 |
|
Greece |
106.0 |
−2.8 |
|
Belgium |
90.1 |
0.2 |
|
Hungary |
72.1 |
−9.3 |
|
Portugal |
71.6 |
−3.9 |
|
France |
70.9 |
−2.6 |
|
Germany |
69.3 |
−1.6 |
|
Canada |
68.1 |
0.2 |
|
Austria |
65.5 |
−1.5 |
|
United States |
61.9 |
−2.6 |
|
Norway |
59.6 |
18.0 |
|
Switzerland |
56.0 |
1.1 |
|
Netherlands |
54.7 |
0.5 |
|
Sweden |
53.9 |
2.3 |
|
Poland |
53.6 |
−3.8 |
|
Spain |
46.7 |
1.8 |
|
United Kingdom |
46.6 |
−2.8 |
|
Finland |
44.9 |
3.7 |
|
Denmark |
36.0 |
4.7 |
|
Slovak Republic |
35.2 |
−3.7 |
|
Iceland |
30.3 |
2.9 |
|
Korea |
27.7 |
3.0 |
|
New Zealand |
27.2 |
3.8 |
|
Australia |
16.1 |
1.2 |
|
Luxembourg |
10.8 |
0.7 |
Source: Organisation for Economic Co-operation and Development (OECD). Factbook 2008. OECD Publishing, April 10, 2008.
KEY TAKEAWAYS
- Over the last 50 years, government purchases fell from about 20% of U.S. GDP to below 20%, but have been rising over the last decade.
- Transfer payment spending has risen sharply, both in absolute terms and as a percentage of real GDP since 1960.\
- The bulk of federal revenues comes from income and payroll taxes. State and local revenues consist primarily of sales and property taxes.
- The government budget balance is the difference between government revenues and government expenditures.
- The national debt is the sum of all past federal deficits minus any surpluses.
TRY IT!
What happens to the national debt when there is a budget surplus? What happens to it when there is a budget deficit? What happens to the national debt if there is a decrease in a surplus? What happens to it if the deficit falls?
Case in Point: Generational Accounting
One method of assessing the degree to which current fiscal policies affect future generations is through a device introduced in the early 1990s called generational accounting. It measures the
impact of current fiscal policies on different generations in the economy, including future generations. Generational accounting is now practiced by governments in many countries, including
the United States and the European Union.
As populations age, the burden of current fiscal policy is increasingly borne by younger people in the population. In most countries, economists computing generational accounts have found
that people age 40 or below will pay more in taxes than they receive in transfer payments, while those age 60 or above will receive more in transfers than they pay in taxes. The differences
are huge. According to a recent study by Jagadeesh Gokhale, summarized in the table below, in 2004 in the United States, a male age 30 could expect to pay $201,300 more than he receives in
government transfers during his lifetime, while another male age 75 could expect to receive $171,100 more in transfers than he paid in taxes during his lifetime. That is a difference of
$372,400! For future generations, those born after the year 2004, the difference is even more staggering. A male born after the year 2005 can expect to pay $332,200 more in taxes than he will
receive in transfer payments. For a woman, the differences are also large but not as great. A woman age 30 in 2004 could expect to pay $30,200 more in taxes than she will receive in transfers
during her lifetime, while a woman age 75 could expect to receive transfers of $184,100 in excess of her lifetime tax burden.
The table below gives generational accounting estimates for the United States for the year 2004 for males and females. Notice that the net burden on females is much lower than for males. That
is because women live longer than men and thus receive Social Security and Medicare benefits over a longer period of time. Women also have lower labor force participation rates and earn less
than men, and pay lower taxes as a result.
|
Year of birth |
Age in 2004 |
Male |
Female |
|---|---|---|---|
|
2005 (future born) |
−1 |
333.2 |
26.0 |
|
2004 (newborn) |
0 |
104.3 |
8.1 |
|
1989 |
15 |
185.7 |
42.0 |
|
1974 |
30 |
201.3 |
30.2 |
|
1959 |
45 |
67.8 |
-54.1 |
|
1944 |
60 |
-162.6 |
-189.4 |
|
1929 |
75 |
-171.1 |
-184.1 |
|
1914 |
90 |
-65.0 |
-69.2 |
Generational accounting has its critics—for example, the table above only measures direct taxes and transfers but omits benefits from government spending on public goods and services. In
addition, government spending programs can be modified, which would alter the impact on future generations. Nonetheless, it does help to focus attention on the sustainability of current
fiscal policies. Can future generations pay for Social Security, Medicare, and other retirement and health care spending as currently configured? Should they be asked to do so?
Sources: Jagadeesh Gokhale, “Generational Accounting,” The New Palgrave Dictionary of Economics, 2nd ed. (forthcoming).
ANSWER TO TRY IT! PROBLEM
A budget surplus leads to a decline in national debt; a budget deficit causes the national debt to grow. If there is a decrease in a budget surplus, national debt still declines but by less than it would have had the surplus not gotten smaller. If there is a decrease in the budget deficit, the national debt still grows, but by less than it would have if the deficit had not gotten smaller.
- 3771 reads
