


Of course, the economy may not be operating at its natural level of employment, so unemployment may be above or below its natural level. In a later chapter we will explore what happens when the economy generates employment greater or less than the natural level. Cyclical unemployment is unemployment in excess of the unemployment that exists at the natural level of employment.
Figure Figure 20.6 shows the unemployment rate in the United States for the period from 1960 through October 2008. We see that it has fluctuated considerably. How much of it corresponds to the natural rate of unemployment varies over time with changing circumstances. For example, in a country with a demographic “bulge” of new entrants into the labor force, frictional unemployment is likely to be high, because it takes the new entrants some time to find their first jobs. This factor alone would raise the natural rate of unemployment. A demographic shift toward more mature workers would lower the natural rate. During recessions, highlighted in Figure Figure 20.6, the part of unemployment that is cyclical unemployment grows. The analysis of fluctuations in the unemployment rate, and the government’s responses to them, will occupy center stage in much of the remainder of this book.
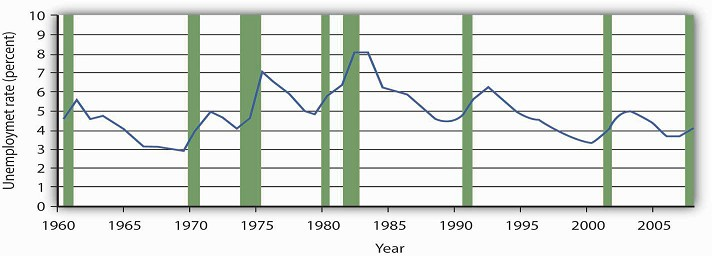
The chart shows the unemployment rate for each year from 1960 to 2008. Recessions are shown as shaded areas.
Source: Economic Report of the President, 2008, Table B-42. Date for 2008 is average of first ten months from the Bureau of Labor Statistics home page.
KEY TAKEAWAYS
- People who are not working but are looking and available for work at any one time are considered unemployed. The unemployment rate is the percentage of the labor force that is unemployed.
- When the labor market is in equilibrium, employment is at the natural level and the unemployment rate equals the natural rate of unemployment.
- Even if employment is at the natural level, the economy will experience frictional and structural unemployment. Cyclical unemployment is unemployment in excess of that associated with the natural level of employment.
TRY IT!
Given the data in the table, compute the unemployment rate in Year 1 and in Year 2. Explain why, in this example, both the number of people employed and the unemployment rate increased.
|
Year |
Number employed (in millions) |
Number unemployed (in millions) |
|---|---|---|
|
1 |
20 |
2 |
|
2 |
21 |
2.4 |
Case in Point: Might Increased Structural Unemployment Explain the “Jobless Recovery” Following the 2001 Recession?
The U.S. 2001 recession was mild by historical standards, but recovery in terms of increased employment seemed painfully slow in coming. Economists Erica Goshen and Simon Potter at the
Federal Reserve Bank of New York think the reason for the slow recovery in jobs may have actually reflected structural changes in the U.S. economy. They argue that during the recession
permanent rather than temporary layoffs predominated and that it takes longer for firms to hire workers into new positions than to hire them back into former jobs.
What is their evidence? When the layoff is temporary, the employer “suspends” the job, due to slack demand, and the employee expects to be recalled once demand picks up. With a permanent
layoff, the employer eliminates the job. So, they looked at the contribution of temporary layoffs to the unemployment rate during the recent recession compared to the situation in the four
recessions before 1990. In the earlier recessions, unemployment from temporary layoffs rose when the economy was shrinking and fell after the economy began to recover. In both the 1991 and
2001 recessions, temporary layoffs were minor. Then, the authors examined job flows in 70 industries. They classified layoffs in an industry as being cyclical in nature if the job losses
during the recession were reversed during the recovery but structural if job losses for the industry continued duringthe recovery. Their analysis revealed that during the recession of the
early 1980s, job losses were about evenly lit between cyclical and structural changes. In the 1991 recession and then more strongly in the 2001 recession, structural changes dominated. “Most
of the industries that lost jobs during the [2001] recession—for example, communications, electronic equipment, and securities and commodities brokers—[were] still losing jobs” in 2003. “The
trend revealed . . . is one in which jobs are relocated from some industries to others, not reclaimed by the same industries that lost them earlier.”
The authors suggest three possible reasons for the recent increased role of structural change: (1) The structural decline in some industries could be the result of overexpansion in those
industries during the 1990s. The high tech and telecommunications industries in particular could be examples of industries that were overbuilt before the 2001 recession. (2) Improved
government policies may have reduced cyclical unemployment. Examination of macroeconomic policy in future chapters will return to this issue. (3) New management strategies to reduce costs may
be promoting leaner staffing. For firms adopting such strategies, a recession may provide an opportunity to reorganize the production process permanently and reduce payrolls in the
process.
Goshen and Potter point out that, for workers, finding new jobs is harder than simply returning to old ones. For firms, making decisions about the nature of new jobs is time consuming at
best. The uncertainty createdby the war in Iraq and the imposition of new accounting standards following the “Enron”-like scandals may have further prolonged the creation of new jobs.
Source: Erica L. Goshen and Simon Potter, “Has Structural Change Contributed to a Jobless Recovery?” Federal Reserve Bank of New York Current
Issuesin Economics and Finance 9, no. 8 (August 2003): 1–7.
ANSWER TO TRY IT! PROBLEM
In Year 1 the total labor force includes 22 million workers, and so the unemployment rate is 2/22 = 9.1%. In Year 2 the total labor force numbers 23.4 million workers; therefore the unemployment rate is 2.4/23.4 = 10.3%. In this example, both the number of people employed and the unemployment rate rose, because more people (23.4 − 22 = 1.4 million) entered the labor force, of whom 1 million found jobs and 0.4 million were still looking for jobs.
- 4132 reads
