


In the chapter that introduced the model of demand and supply (Demand and Supply), we saw that an inferior good is one for which demand falls when income rises. It is likely to be a good that people do not really like very much. When incomes are low, people consume the inferior good because it is what they can afford. As their incomes rise and they can afford something they like better, they consume less of the inferior good. When the price of an inferior good falls, two things happen:
Consumers will substitute more of the inferior good for other goods because its price has fallen relative to those goods. The quantity demanded increases as a result of the substitution effect. The lower price effectively makes consumers richer. But, because the good is inferior, this reduce quantity demanded.
The case of inferior goods is thus quite different from that of normal goods. The income effect of a price change works in a direction opposite to that of the substitution effect in the case of an inferior good, whereas it reinforces the substitution effect in the case of a normal good.
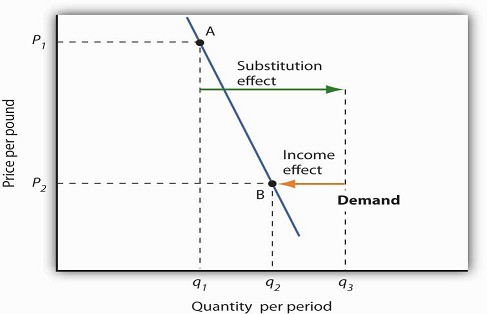
The substitution and income effects work against each other in the case of inferior goods. The consumer begins atpoint A, consuming q1 units of the good at a price P1. When the price falls to P2, the consumer moves to point B,increasing quantity demanded to q2. The substitution effect increases quantity demanded to qs, but the income effect reduces it from qs to q2.
Figure 7.6 illustrates the substitution and income effects of a price reduction for an inferior good. When the price falls from P1 to P2, the quantity demanded by a consumer increases from q1 to q2. The substitution effect increases quantity demanded from q1 to qs. But the income effect reduces quantity demanded from qs to q2; the substitution effect is stronger than the income effect. The result is consistent with the law of demand: A reduction in price increases the quantity demanded. The quantity demandedis smaller, however, than it would be if the good were normal. Inferior goods are therefore likely to have less elastic demand than normal goods.
KEY TAKEAWAYS
- Individual demand curves reflect utility-maximizing adjustment by consumers to changes in price.
- Market demand curves are found by summing horizontally the demand curves of all the consumers in themarket.
- The substitution effect of a price change changes consumption in a direction opposite to the pricechange.
- The income effect of a price change reinforces the substitution effect if the good is normal; it moves consumption in the opposite direction if the good is inferior.
TRY IT!
Ilana Drakulic has an entertainment budget of $200 per semester, which she divides among purchasing CDs,going to concerts, eating in restaurants, and so forth. When the price of CDs fell from $20 to $10, her purchases rose from 5 per semester to 10 per semester. When asked how many she would have bought if herbudget constraint were $150 (since with $150 she could continue to buy 5 CDs and as before still have $100 for spending on other items), she said she would have bought 8 CDs. What is the size of her substitution effect? Her income effect? Are CDs normal or inferior for her? Which exhibit, Figure 7.6 or Figure 7.7, depicts more accurately her demand curve for CDs?
Case in Point: Found! An Upward-Sloping Demand Curve
© 2010 Jupiterimages Corporation
The fact that income and substitution effects move in opposite directions in the case of inferior goods raises a tantalizing possibility: What if the income effect were the stronger of the
two? Could demand curves be upward sloping?
The answer, from a theoretical point of view, is yes. If the income effect in Figure 7.6 were larger than the substitution effect, the decrease in price would
reduce the quantity demanded below q1. The result would be a reduction in quantity demanded in response to a reduction in price. The demand curve would be upward sloping!
The suggestion that a good could have an upward-sloping demand curve is generally attributed to Robert Giffen, a British journalist who wrote widely on economic matters late in the nineteenth
century. Such goods are thus called Giffen goods. To qualify as a Giffen good, a good must be inferior and must have an income effect strong enough to overcome the substitution effect. The
example often cited of a possible Giffen good is the potato during the Irish famine of 1845–1849. Empirical analysis by economists using available data, however, has refuted the notion of the
upward-sloping demand curve for potatoes at that time. The most convincing parts of the refutation were to point out that (a) given the famine, there were not more potatoes available for
purchase then and (b) the price of potatoes may not have even increased during the period!
A recent study by Robert Jensen and Nolan Miller, though, suggests the possible discovery of a pair of Giffengoods. They began their search by thinking about the type of good that would be
likely to exhibit Giffen behavior and argued that, like potatoes for the poor Irish, it would be a main dietary staple of a poor population. Insuch a situation, purchases of the item are such
a large percentage of the diet of the poor that when the item’s price rises, the implicit income of the poor falls drastically. In order to subsist, the poor reduce consumption of other goods
so they can buy more of the staple. In so doing, they are able to reach a caloric intake that is higher than what can be achieved by buying more of other preferred foods that unfortunately
supply fewer calories.
Their preliminary empirical work shows that in southern China rice is a Giffen good for poor consumers whilein northern China noodles are a Giffen good. In both cases, the basic good (rice or
noodles) provides calories at a relatively low cost and dominates the diet, while meat is considered the tastier but higher cost-per-caloriefood. Using detailed household data, they estimate
that among the poor in southern China a 10% increase in the price of rice leads to a 10.4% increase in rice consumption. For wealthier households in the region, rice is inferior but not
Giffen. For both groups of households, the income effect of a price change moves consumption in the opposite direction of the substitution effect. Only in the poorest households, however,
does it swamp the substitution effect, leading to an upward-sloping demand curve for rice for poor households. Innorthern China, the net effect of a price increase on quantity demanded of
noodles is smaller, though it still leads to higher noodle consumption in the poorest households of that region.
In a similar study, David McKenzie tested whether tortillas were a Giffen good for poor Mexicans. He found,however, that they were an inferior good but not a Giffen good. He speculated that
the different result may stem from poor Mexicans having a wider range of substitutes available to them than do the poor in China.
Because the Jensen/Miller study is the first vindication of the existence of a Giffen good despite a very long search, the authors have avoided rushing to publication of their results.
Rather, they have made available a preliminary version of the study reported on here while continuing to refine their estimation.
Sources: Robert Jensen and Nolan Miller, “Giffen Behavior: Theory and Evidence,” KSG Faculty Research Working Papers Series RWP02-014, 2002 available at
ksghome.harvard.edu/~nmiller/giffen.html or http://ssrn.com/abstract=31086. At the authors’ request we include the following note on the
preliminary version: Because we have received numerous requests for this paper, we are making this early draft available. The results presented in this version, while strongly suggestive
of Giffen behavior, are preliminary. In the near future we expect to acquire additional data that will allow us to revise our estimation technique. In particular, monthly temperature,
precipitation, and other weather data will enable us to use an instrumental variables approach to address the possibility that the observed variation in prices is not exogenous. Once
available, the instrumental variables results will be incorporated into future versions of the paper.
; David McKenzie, “Are Tortillas a Giffen Good in Mexico?” Economics Bulletin
15:1 (2002): 1–7.
ANSWER TO TRY IT ! PROBLEM
One hundred fifty dollars is the income that allows Ms. Drakulic to purchase the same items as before, andthus can be used to measure the substitution effect. Looking only at the income-compensated price change (that is, holding her to the same purchasing power as in the original relative price situation), we find that thesubstitution effect is 3 more CDs (from 5 to 8). The CDs that she buys beyond 8 constitute her income effect; it is 2 CDs. Because the income effect reinforces the substitution effect, CDs are a normal good for her and her demand curve is similar to that shown in Figure 7.5.
- 9074 reads
