


Learning Objectives
- Explain the basic assumptions of the classical school of thought that dominated macroeconomic thinking before the Great Depression, and tell why the severity of the Depression struck a major blow to this view.
- Compare Keynesian and classical macroeconomic thought, discussing the Keynesian explanation of prolonged recessionary and inflationary gaps as well as the Keynesian approach to correcting these problems.
It is hard to imagine that anyone who lived during the Great Depression was not profoundly affected by it. From the beginning of the Depression in 1929 to the time the economy hit bottom in 1933, real GDP plunged nearly 30%. Real per capita disposable income sank nearly 40%. More than 12 million people were thrown out of work; the unemployment rate soared from 3% in 1929 to 25% in 1933. Some 85,000 businesses failed. Hundreds of thousands of families lost their homes. By 1933, about half of all mortgages on all urban, owner-occupied houses were delinquent.
The economy began to recover after 1933, but a huge recessionary gap persisted. Another downturn began in 1937, pushing the unemployment rate back up to 19% the following year.
The contraction in output that began in 1929 was not, of course, the first time the economy had slumped. But never had the U.S. economy fallen so far and for so long a period. Economic historians estimate that in the 75 years before the Depression there had been 19 recessions. But those contractions had lasted an average of less than two years. The Great Depression lasted for more than a decade. The severity and duration of the Great Depression distinguish it from other contractions; it is for that reason that we give it a much stronger name than “recession.”
Figure 32.1shows the course of real GDP compared to potential output during the Great Depression.The economy did not approach potential output until 1941, when the pressures of world war forced sharp increases in aggregate demand.
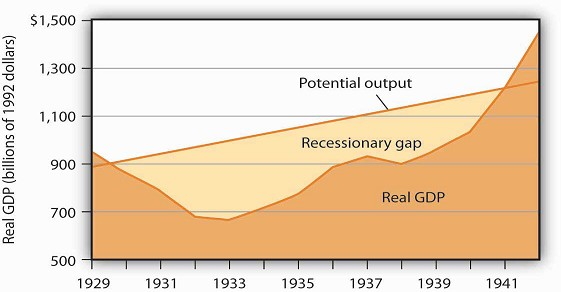
The dark-shaded area shows real GDP from 1929 to 1942, the upper line shows potential output, and the lightshaded area shows the difference between the two—the recessionary gap. The gap nearly closed in 1941; an inflationary gap had opened by 1942. The chart suggests that the recessionary gap remained very large throughout the 1930s.
- 5100 reads
