


Implicit in the concepts of demand and supply is a constant interaction and adjustment that economists illustrate with the circular flow model. The circular flow model provides a look at how markets work and how they are related to each other. It shows flows of spending and income through the economy.
A great deal of economic activity can be thought of as a process of exchange between households and firms. Firms supply goods and services to households. Households buy these goods and services from firms. Households supply factors of production—labor, capital, and natural resources—that firms require. The payments firms make in exchange for these factors represent the incomes households earn.
The flow of goods and services, factors of production, and the payments they generate is illustrated in Figure 3.18. This circular flow model of the economy shows the interaction of households and firms as they exchange goods and services and factors of production. For simplicity, the model here shows only the private domestic economy; it omits the government and foreign sectors.
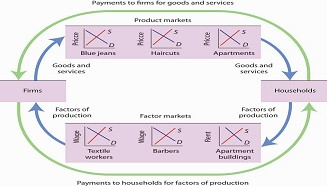
This simplified circular flow model shows flows of spending between households and firms through product and factor markets. The inner arrows show goods and services flowing from firms to households and factors of production flowing from households to firms. The outer flows show the payments for goods, services, and factors of production. These flows, in turn, represent millions of individual markets for products and factors of production.
The circular flow model shows that goods and services that households demand are supplied by firms in product markets. The exchange for goods and services is shown in the top half of Figure 3.18. The bottom half of the exhibit illustrates the exchanges that take place in factor markets. factor markets are markets in which households supply factors of production—labor, capital, and natural resources— demanded by firms.
Our model is called a circular flow model because households use the income they receive from their supply of factors of production to buy goods and services from firms. Firms, in turn, use the payments they receive from households to pay for their factors of production.
The demand and supply model developed in this chapter gives us a basic tool for understanding what is happening in each of these product or factor markets and also allows us to see how these markets are interrelated. In Figure 3.18, markets for three goods and services that households want—blue jeans, haircuts, and apartments—create demands by firms for textile workers, barbers, and apartment buildings. The equilibrium of supply and demand in each market determines the price and quantity of that item. Moreover, a change in equilibrium in one market will affect equilibrium in related markets. For example, an increase in the demand for haircuts would lead to an increase in demand for barbers. Equilibrium price and quantity could rise in both markets. For some purposes, it will be adequate to simply look at a single market, whereas at other times we will want to look at what happens in related markets as well.
In either case, the model of demand and supply is one of the most widely used tools of economic analysis. That widespread use is no accident. The model yields results that are, in fact, broadly consistent with what we observe in the marketplace. Your mastery of this model will pay big dividends in your study of economics.
KET TAKEAWAYS
- The equilibrium price is the price at which the quantity demanded equals the quantity supplied. It is determined by the intersection of the demand and supply curves.
- A surplus exists if the quantity of a good or service supplied exceeds the quantity demanded at the current price; it causes downward pressure on price. A shortage exists if the quantity of a good or service demanded exceeds the quantity supplied at the current price; it causes upward pressure on price.
- An increase in demand, all other things unchanged, will cause the equilibrium price to rise; quantity supplied will increase. A decrease in demand will cause the equilibrium price to fall; quantity supplied will decrease.
- An increase in supply, all other things unchanged, will cause the equilibrium price to fall; quantity demanded will increase. A decrease in supply will cause the equilibrium price to rise; quantity demanded will decrease.
- To determine what happens to equilibrium price and equilibrium quantity when both the supply and demand curves shift, you must know in which direction each of the curves shifts and the extent to which each curve shifts.
- The circular flow model provides an overview of demand and supply in product and factor markets and suggests how these markets are linked to one another.
TRY IT!
What happens to the equilibrium price and the equilibrium quantity of DVD rentals if the price of movie theater tickets increases and wages paid to DVD rental store clerks increase, all other things unchanged? Be sure to show all possible scenarios, as was done in Figure 3.16. Again, you do not need actual numbers to arrive at an answer. Just focus on the general position of the curve(s) before and after events occurred.
Case in Point: Demand, Supply, and Obesity
Why are so many Americans fat? Put so crudely, the question may seem rude, but, indeed, the number of obese Americans has increased by more than 50% over the last generation, and obesity may
now be the nation’s number one health problem. According to Sturm Roland in a recent RAND Corporation study, “Obesity appears to have a stronger association with the occurrence of chronic
medical conditions, reduced physical health-related quality of life and increased health care and medication expenditures than smoking or problem drinking.”
Many explanations of rising obesity suggest higher demand for food. What more apt picture of our sedentary life style is there than spending the afternoon watching a ballgame on TV, while
eating chips and salsa, followed by a dinner of a lavishly topped, take-out pizza? Higher income has also undoubtedly contributed to a rightward shift in the demand curve for food. Plus, any
additional food intake translates into more weight increase because we spend so few calories preparing it, either directly or in the process of earning the income to buy it. A study by
economists Darius Lakdawalla and Tomas Philipson suggests that about 60% of the recent growth in weight may be explained in this way—that is, demand has shifted to the right, leading to an
increase in the equilibrium quantity of food consumed and, given our less strenuous life styles, even more weight gain than can be explained simply by the increased amount we are
eating.
What accounts for the remaining 40% of the weight gain? Lakdawalla and Philipson further reason that a rightward shift in demand would by itself lead to an increase in the quantity of food as
well as an increase in the price of food. The problem they have with this explanation is that over the post-World War II period, the relative price of food has declined by an average of 0.2
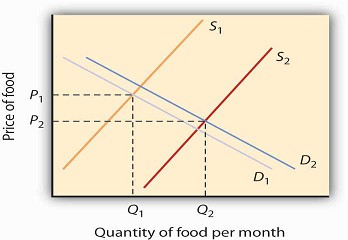
percentage points per year. They explain the fall in the price of food by arguing that agricultural innovation has led to a substantial rightward shift in the supply curve of food. As shown,
lower food prices and a higher equilibrium quantity of food have resulted from simultaneous rightward shifts in demand and supply and that the rightward shift in the supply of food from S1 to
S2 has been substantially larger than the rightward shift in the demand curve from D1 to D2.
Sources: Roland, Sturm, “The Effects of Obesity, Smoking, and Problem Drinking on Chronic Medical Problems and Health Care Costs,” Health Affairs, 2002; 21(2): 245–253. Lakdawalla, Darius and Tomas Philipson, “The Growth of Obesity and Technological Change: A Theoretical and Empirical Examination,” National Bureau of Economic Research Working Paper no. w8946, May 2002.
ANSWER TO TRY IT! PROBLEM
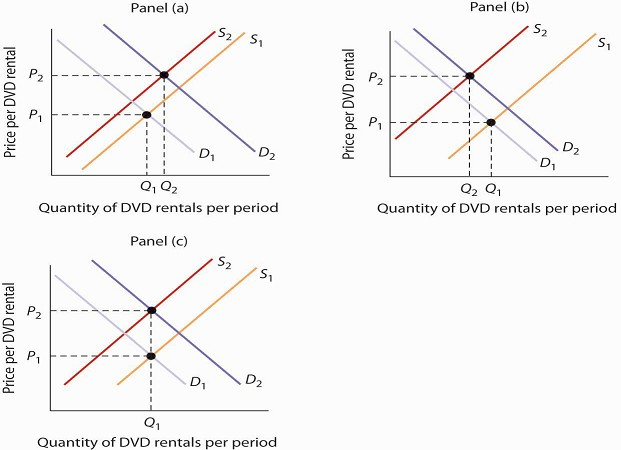
An increase in the price of movie theater tickets (a substitute for DVD rentals) will cause the demand curve for DVD rentals to shift to the right. An increase in the wages paid to DVD rental
store clerks (an increase in the cost of a factor of production) shifts the supply curve to the left. Each event taken separately causes equilibrium price to rise. Whether equilibrium
quantity will be higher or lower depends on which curve shifted more.
If the demand curve shifted more, then the equilibrium quantity of DVD rentals will rise [Panel (a)]. If the supply curve shifted more, then the equilibrium quantity of DVD rentals will fall
[Panel (b)]. If the curves shifted by the same amount, then the equilibrium quantity of DVD rentals would not change [Panel (c)].
- 21483 reads
