


The circular flow model suggests that capital, like other factors of production, is supplied by households to firms. Firms, in turn, pay income to those households for the use of their capital. Generally speaking, however, capital is actually owned by firms themselves. General Motors owns its assembly plants, and Wal-Mart owns its stores; these firms therefore own their capital. But firms, in turn, are owned by people—and those people, of course, live in households. It is through their ownership of firms that households own capital.
A firm may be owned by one individual (a sole proprietorship), by several individuals (a partnership), or by shareholders who own stock in the firm (a corporation). Although most firms in the United States are sole proprietorships or partnerships, the bulk of the nation’s total output (about 90%) is produced by corporations. Corporations also own most of the capital (machines, plants, buildings, and the like).
This section describes how the prices of shares of corporate stock, shares in the ownership of a corporation, are determined by the interaction of demand and supply. Ultimately, the same forces that determine the value of a firm’s stock determine the value of a sole proprietorship or partnership.
When a corporation needs funds to increase its capital or for other reasons, one means at its disposal is to issue new stock in the corporation. (Other means include borrowing funds or using past profits.) Once the new shares have been sold in what is called an initial public offering (IPO), the corporation receives no further funding as shares of its stock are bought and sold on the secondary market. The secondary market is the market for stocks that have been issued in the past, and the daily news reports about stock prices almost always refer to activity in the secondary market. Generally, the corporations whose shares are traded are not involved in these transactions.
The stock market is the set of institutions in which shares of stock are bought and sold. The New York Stock Exchange (NYSE) is one such institution. There are many others all over the world, such as the DAX in Germany and the Bolsa in Mexico. To buy or sell a share of stock, one places an order with a stockbroker who relays the order to one of the traders at the NYSE or at some other exchange.
The process through which shares of stock are bought and sold can seem chaotic. At many exchanges, traders with orders from customers who want to buy stock shout out the prices those customers are willing to pay. Traders with orders from customers who want to sell shout out offers of prices at which their customers are willing to sell. Some exchanges use electronic trading, but the principle is the same: if the price someone is willing to pay matches the price at which someone else is willing to sell, the trade is made. The most recent price at which a stock has traded is reported almost instantaneously throughout the world.
Figure 4.4 applies the model of demand and supply to the determination of stock prices. Suppose the demand curve for shares in Intel Corporation is given by D1 and the supply by S1. (Even though the total number of shares outstanding is fixed at any point in time, the supply curve is not vertical. Rather, the supply curve is upward sloping because it represents how many shares current owners are prepared to sell at each price, and that number will be greater at higher prices.) Suppose that these curves intersect at a price of $25, at which Q1 shares are traded each day. If the price were higher, more shares would be offered for sale than would be demanded, and the price would quickly fall. If the price were lower, more shares would be demanded than would be supplied, and the price would quickly rise. In general, we can expect the prices of shares of stock to move quickly to their equilibrium levels.
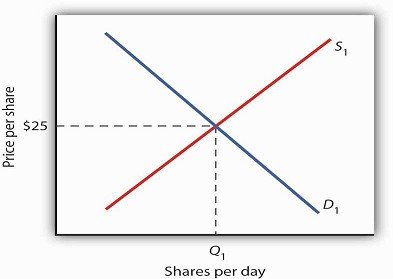
The intersection of the demand and supply curves for shares of stock in a particular company determines the equilibrium price for a share of stock. But what determines the demand and supply for shares of a company’s stock?
The owner of a share of a company’s stock owns a share of the company, and, hence, a share of its profits; typically, a corporation will retain and reinvest some of its profits to increase its future profitability. The profits kept by a company are called retained earnings. Profits distributed to shareholders are called dividends. Because a share of stock gives its owner a claim on part of a company’s future profits, it follows that the expected level of future profits plays a role in determining the value of its stock.
Of course, those future profits cannot be known with certainty; investors can only predict what they might be, based on information about future demand for the company’s products, future costs of production, information about the soundness of a company’s management, and so on. Stock prices in the real world thus reflect estimates of a company’s profits projected into the future.
The downward slope of the demand curve suggests that at lower prices for the stock, more people calculate that the firm’s future earnings will justify the stock’s purchase. The upward slope of the supply curve tells us that as the price of the stock rises, more people conclude that the firm’s future earnings do not justify holding the stock and therefore offer to sell it. At the equilibrium price, the number of shares supplied by people who think holding the stock no longer makes sense just balances the number of shares demanded by people who think it does.
What factors, then, cause the demand or supply curves for shares of stocks to shift? The most important factor is a change in the expectations of a company’s future profits. Suppose Intel announces a new generation of computer chips that will lead to faster computers with larger memories. Current owners of Intel stock would adjust upward their estimates of what the value of a share of Intel stock should be. At the old equilibrium price of $25 fewer owners of Intel stock would be willing to sell. Since this would be true at every possible share price, the supply curve for Intel stock would shift to the left, as shown in Figure 4.5. Just as the expectation that a company will be more profitable shifts the supply curve for its stock to the left, that same change in expectations will cause more people to want to purchase the stock, shifting the demand curve to the right. In Figure 4.5, we see the supply curve shifting to the left, from S1 to S2, while the demand curve shifts to the right, from D1 to D2.
Other factors may alter the price of an individual corporation’s share of stock or the level of stock prices in general. For example, demographic change and rising incomes have affected the demand for stocks in recent years. For example, with a large proportion of the U.S. population nearing retirement age and beginning to think about and plan for their lives during retirement, the demand for stocks has risen.
Information on the economy as a whole is also likely to affect stock prices. If the economy overall is doing well and people expect that to continue, they may become more optimistic about how profitable companies will be in general, and thus the prices of stocks will rise. Conversely, expectations of a sluggish economy, as happened in the fall of 2008, could cause stock prices in general to fall.
The stock market is bombarded with new information every minute of every day. Firms announce their profits of the previous quarter. They announce that they plan to move into a new product line or sell their goods in another country. We learn that the price of Company A’s good, which is a substitute for one sold by Company B, has risen. We learn that countries sign trade agreements, launch wars, or make peace. All of this information may affect stock prices because any information can affect how buyers and sellers value companies.
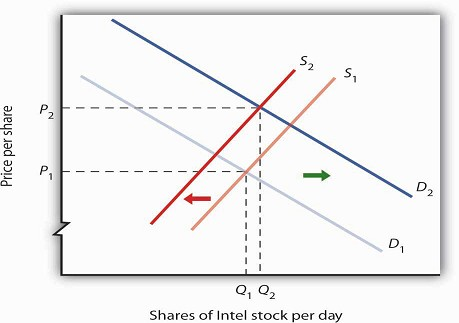
If financial investors decide that a company is likely to be more profitable, then the supply of the stock shifts to the left (in this case, from S1 to S2), and the demand for the stock shifts to the right (in this case, from D1 to D2), resulting in an increase in price from P1 to P2.
KEY TAKEAWAYS
Technological change, which has caused the supply curve for computing power to shift to the right, is the main reason for the rapid increase in equilibrium quantity and decrease in
equilibrium price of personal computers.
The increase in crude oil and gasoline prices in 2008 was driven primarily by increased demand for crude oil, an increase that was created by economic growth throughout the world. Crude oil
and gas prices fell markedly as world economic growth subsided later in the year.
Higher gasoline prices increased the cost of producing virtually every good and service, shifting supply curves for most goods and services to the left. This tended to push prices up and
output down. Demand and supply determine prices of shares of corporate stock. The equilibrium price of a share of stock strikes a balance between those who think the stock is worth more and
those who think it is worth less than the current price.
If a company’s profits are expected to increase, the demand curve for its stock shifts to the right and the supply curve shifts to the left, causing equilibrium price to rise. The opposite
would occur if a company’s profits were expected to decrease.
Other factors that influence the price of corporate stock include demographic and income changes and the overall health of the economy.
TRY IT!
Suppose an airline announces that its earnings this year are lower than expected due to reduced ticket sales.
The airline spokesperson gives no information on how the company plans to turn things around. Use the model of demand and supply to show and explain what is likely to happen to the price of
the airline’s stock.
Case in Point: 9/11 and the Stock Market
The hijacking of four airplanes and the steering of them into buildings is perhaps the only disaster that has become universally known by its date: September 11, 2001—hence, 9/11. “9/11” will
remain etched in our collective memory for a great many generations.
Disasters such as 9/11 represent the kind of complete surprises that dramatically affect stock prices, if only temporarily. The New York Stock Exchange was closed on the day of the attack and
remained closed for six days. On the day the market opened, the Dow Jones Industrial Average (the “DOW”, a widely used gauge of stock prices) fell nearly 685 points to 8,920. It was one of
the biggest one-day decline in U.S. history.
Why did the attacks on September 11, 2001, have such a dramatic short-term impact on the stock market? The attacks of 9/11 plunged the United States and much of the rest of the world into a
very frightening war against terrorism. The realization that terrorists could strike anytime and in any place sapped consumer and business confidence alike and affected both the demand and
supply of most stocks. The attacks on 9/11 provoked fear and uncertainty—two things that are certain to bring stock prices down, at least until other events and more information cause
expectations to change again in this very responsive market.
ANSWER TO TRY IT! PROBLEM
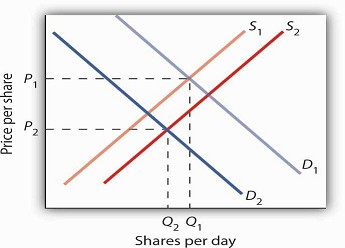
The information given in the problem suggests that the airline’s profits are likely to fall below expectations. Current owners of the airline’s stock and potential buyers of the stock would
adjust downward their estimates of what the value of the corporation’s stock should be. As a result the supply curve for the stock would increase, shifting it to the right, while the demand
curve for the stock would decrease, shifting it to the left. As a result, equilibrium price of the stock falls from P1 to P2. What happens to equilibrium quantity depends on the extent to
which each curve shifts. In the diagram, equilibrium quantity is shown to decrease from Q1 to Q2.
- 4259 reads
