


Real GDP or GNP estimates are often used in comparing economic performance among countries. In making such comparisons, it is important to keep in mind the general limitations to these measures of economic performance that we noted earlier. Further, countries use different methodologies for collecting and compiling data.
Three other issues are important in comparing real GDP or GNP for different countries: the adjustment of these figures for population, adjusting to a common currency, and the incorporation of nonmarket production.
In international comparisons of real GNP or real GDP, economists generally make comparisons not of real GNP or GDP but of per capita real GNP or GDP, which equals a country’s real GNP or GDP divided by its population. In 2007, for example, Japan had a real GDP of about $5,000 billion and Luxembourg had a real GDP of about $25 billion, both figures in U.S. $2,000. We can conclude that Japan’s economy produced far more goods and services than did Luxembourg’s. But Japan had almost 300 times as many people as did Luxembourg. Japan’s per capita real GDP in 2007 was $40,656; Luxembourg’s was $54,482, the highest in the world that year.
Figure Figure 21.7 compares per capita real GNP for 11 countries in 2007. It is based on data that uses a measure called “international dollars” in order to correct for differences in the purchasing power of $1 across countries. The data also attempt to adjust for nonmarket production (such as that of rural families that grow their own food, make their own clothing, and produce other household goods and services themselves).
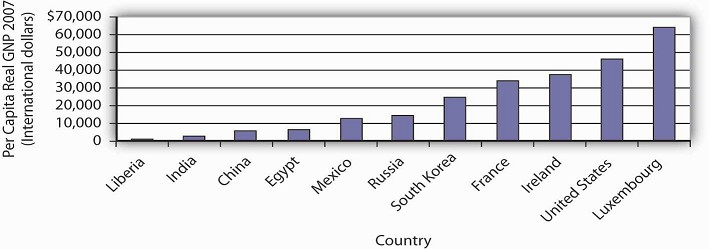
Source: World Bank, World Development Indicators Online
The disparities in income are striking; Luxembourg, the country with the highest per capita real GNP, had an income level more than 200 times greater than Liberia, the country with the lowest per capita real GNP.
What can we conclude about international comparisons in levels of GDP and GNP? Certainly we must be cautious. There are enormous difficulties in estimating any country’s total output. Comparing one country’s output to another presents additional challenges. But the fact that a task is difficult does not mean it is impossible. When the data suggest huge disparities in levels of GNP per capita, for example, we observe real differences in living standards.
KEY TAKEAWAYS
- Real GDP or real GNP is often used as an indicator of the economic well-being of a country.
- Problems in the measurement of real GDP, in addition to problems encountered in converting from nominal to real GDP, stem from revisions in the data and the difficulty of measuring output in some sectors, particularly the service sector.
- Conceptual problems in the use of real GDP as a measure of economic well-being include the facts that it does not include nonmarket production and that it does not properly adjust for “bads” produced in the economy.
- Per capita real GDP or GNP can be used to compare economic performance in different countries.
TRY IT!
What impact would each of the following have on real GDP? Would economic well-being increase or decrease as a result?
- On average, people in a country decide to increase the number of hours they work by 5%.
- Spending on homeland security increases in response to a terrorist attack.
- The price level and nominal GDP increase by 10%.
Case in Point: Per Capita Real GDP and Olympic Medal Counts
In the popular lore, the Olympics provide an opportunity for the finest athletes in the world to compete with each other head-to-head on the basis of raw talent and hard work. And yet,
contenders from Laos tend to finish last or close to it in almost any event in which they compete. One Laotian athlete garnered the unenviable record of having been the slowest entrant in the
nearly half-century long history of the 20-kilometer walk. In contrast, U.S. athletes won 103 medals at the 2004 Athens Olympics and 110 medals at the 2008 Beijing Olympics. Why do Laotians
fare so poorly and Americans so well, with athletes from other countries falling in between?
Economists Daniel K. N. Johnson and Ayfer Ali have been able to predict with astonishing accuracy the number of medals different countries will win on the basis of a handful of factors,
including population, climate, political structure, and real per capita GDP. For example, they predicted that the United States would win 103 medals in Athens and that is precisely how many
the United States won. They predicted 103 medals for the United States in Beijing; 110 were won. They did not expect the Laotians to win any medals in either Athens or Beijing, and that was
indeed the outcome. Johnson and Ali estimated that summer game participant nations average one more medal per additional $1,000 of per capita real GDP. With per capita real GDP in Laos less
than the equivalent of $500 compared to per capita real GDP in the United States of about $38,000, the results for these two nations could be considered a foregone conclusion. According to
Johnson and Ali, “High productive capacity or income per person displays an ability to pay the costs necessary to send athletes to the Games, and may also be associated with a higher quality
of training and better equipment.” For example, a Laotian swimmer at Athens, Vilayphone Vongphachanh, had never practiced in an Olympic-size pool, and a runner, Sirivanh Ketavong, had worn
the same running shoes for four years. The good news is that as the per capita real GDP in some relatively poor countries has risen, the improved living standards have led to increased
Olympic medal counts. China, for instance, won 28 medals in 1988 and 63 in 2004. As the host for the 2008 games, it won an impressive total of 100 medals. While not a perfect measure of the
well-being of people in a country, per capita real GDP does tell us about the opportunities available to the average citizen in a country. Americans would surely find it hard to imagine
living at the level of consumption of the average Laotian. In The Progress Paradox: How Life Gets Better While People Feel Worse, essayist Gregg Easterbrook notes that a higher material
standard of living is not associated with higher reported happiness. But, he concludes, the problems of prosperity seem less serious than those of poverty, and prosperity gives people and
nations the means to address problems. The Olympic medal count for each nation strongly reflects its average standard of living and hence the opportunities available to its citizens.
Sources: Gregg Easterbrook, The Progress Paradox: How Life Gets Better While People Feel Worse (New York: Random House, 2003); Daniel K. N. Johnson and Ayfer
Ali, “A Tale of Two Seasons: Participation and Medal Counts at the Summer and Winter Olympic Games,” Social Science Quarterly 84, no. 4 (December 2004): 974–93; David Wallechinsky, “Why I’ll
Cheer for Laos,” Parade Magazine, August 8, 2004, p. 8.
ANSWER TO TRY IT! PROBLEM
- Real GDP would increase. Assuming the people chose to increase their work effort and forgo the extra leisure, economic well-being would increase as well.
- Real GDP would increase, but the extra expenditure in the economy was due to an increase in something “bad,” so economic well-being would likely be lower.
- No change in real GDP. For some people, economic well-being might increase and for others it might decrease, since inflation does not affect each person in the same way.
- 5529 reads
