


Just as entry eliminates economic profits in the long run, exit eliminates economic losses. In Figure 9.13, Panel (a) shows the case of an industry in which the market price P1 is below ATC. In Panel (b), at price P1 a single firm produces a quantity q1, assuming it is at least covering its average variable cost.The firm’s losses are shown by the shaded rectangle bounded by its average total cost C1 and price P1 and by output q1.
Because firms in the industry are losing money, some will exit. The supply curve in Panel (a) shiftsto the left, and it continues shifting as long as firms are suffering losses. Eventually the supply curve shifts all the way to S2, price rises to P2, and economic profits return to zero.
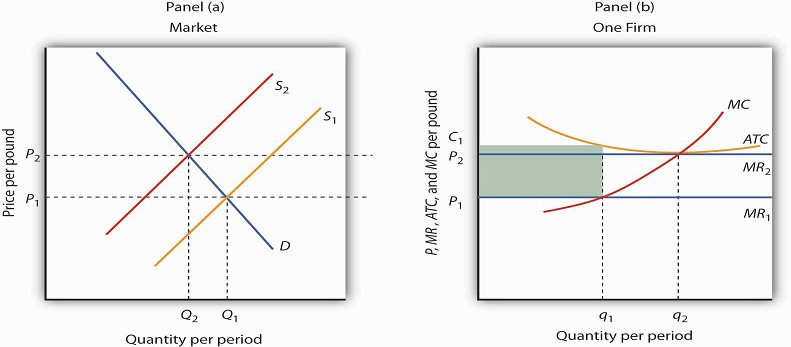
Panel (b) shows that at the initial price P1, firms in the industry cannot cover average total cost (MR1 is below ATC).That induces some firms to leave the industry, shifting the supply curve in Panel (a) to S2, reducing industry output to Q2 and raising price to P2. At that price (MR2), firms earn zero economic profit, and exit from the industry ceases.Panel (b) shows that the firm increases output from q1 to q2; total output in the market falls in Panel (a) because there are fewer firms. Notice that in Panel (a) quantity is designated by uppercase Q, while in Panel (b) quantity is designated by lowercase q. This convention is used throughout the text to distinguish between the quantity supplied in the market (Q) and the quantity supplied by a typical firm (q).
- 3189 reads
