


The Case in Point on presidents and growth at the end of this section suggests a startling fact: the U.S. growth rate began slowing in the 1970s, did not recover until the mid-1990s, only to slow down again in the 2000s. The question we address here is: does it matter? Does a percentage point drop in the growth rate make much difference? It does. To see why, let us investigate what happens when a variable grows at a particular percentage rate.
Suppose two economies with equal populations start out at the same level of realGDP but grow at different rates. Economy A grows at a rate of 3.5%, and Economy B grows at a rate of 2.4%. After a year, the difference in real GDP will hardly be noticeable. After a decade, however, real GDP in Economy A will be 11% greater than in Economy B. Over longer periods, the difference will be more dramatic. After 100 years, for example, income in Economy A will be nearly three times as great as in Economy B. If population growth in the two countries has been the same, the people of Economy A will have a far higher standard of living than those in Economy B. The difference in real GDP per person will be roughly equivalent to the difference that exists today between Great Britain and Mexico.
Over time, small differences in growth rates create large differences in incomes. An economy growing at a 3.5% rate increases by 3.5% of its initial value in the first year. In the second year, the economy increases by 3.5% of that new, higher value. In the third year, it increases by 3.5% of a still higher value. When a quantity grows at a given percentage rate, it experiences exponential growth. A variable that grows exponentially follows a path such as those shown for potential output in Figure 23.1 and Figure 23.2. These curves become steeper over time because the growth rate is applied to an ever larger base.
A variable growing at some exponential rate doubles over fixed intervals of time. The doubling time is given by the rule of 72, which states that a variable’s approximate doubling time equals 72 divided by the growth rate, stated as a whole number. If the level of income were increasing at a 9% rate, for example, its doubling time would be roughly 72/9, or 8 years. Let us apply this concept of a doubling time to the reduction in the U.S. growth rate. Had the U.S. economy continued to grow at a 3.5% rate after 1970, then its potential output would have doubled roughly every 20 years (72/3.5 = 20). That means potential output would have doubled by 1990, would double again by 2010, and would double again by 2030. Real GDP in 2030 would thus be eight times as great as its 1970 level. Growing at a 2.4% rate, however, potential output doubles only every 30 years (72/2.4 = 30). It would take until 2000 to double once from its 1970 level, and it would double once more by 2030. Potential output in 2030 would thus be four times its 1970 level if the economy grew at a 2.4% rate (versus eight times its 1970 level if it grew at a 3.5% rate). The 1.1% difference in growth rates produces a 100% difference in potential output by 2030. The different growth paths implied by these growth rates are illustrated in Figure 23.3.
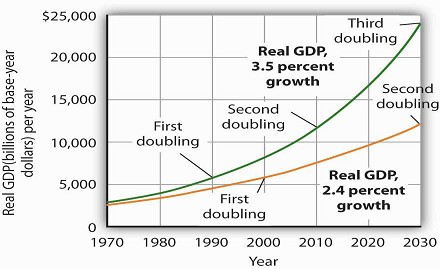
The chart suggests the significance in the long run of a small difference in the growth rate of real GDP. We begin in 1970, when real GDP equaled $2,873.9 billion. If real GDP grew at an annual rate of 3.5% from that year, it would double roughly every 20 years: in 1990, 2010, and 2030. Growth at a 2.4% rate, however, implies doubling every 30 years: in 2000 and 2030. By 2030, the 3.5% growth rate leaves real GDP at twice the level that would be achieved by 2.4% growth.
- 2871 reads
