


Figure 15.5 illustrates the effect of a
subsidy to a supplier. As in Figure
15.4, the amount  is demanded in the free trade equilibrium and,
of this, Qs is supplied domestically. With a subsidy per unit of output sold, the government can reduce the supply cost of the domestic supplier, thereby shifting the supply curve downward from
S to S'. In this illustration, the total quantity demanded remains at
is demanded in the free trade equilibrium and,
of this, Qs is supplied domestically. With a subsidy per unit of output sold, the government can reduce the supply cost of the domestic supplier, thereby shifting the supply curve downward from
S to S'. In this illustration, the total quantity demanded remains at  , but the domestic share increases to Q's
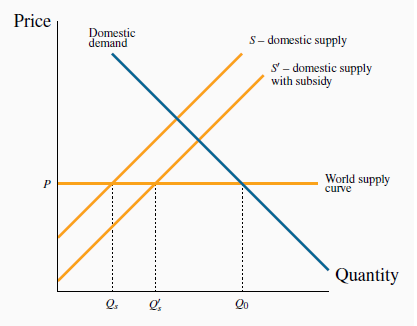
With a world supply price of P, a domestic supply curve S, and a domestic demand D, the amount Qo is purchased. Of this, Qs is supplied domestically and (Qo - Qs) by foreign suppliers. A per-unit subsidy to domestic suppliers shifts their supply curve to S0 , and increases their market share to Q's.
The new equilibrium represents a misallocation of resources. When domestic output increases from Qs to Q's, a low-cost international producer is being replaced by a higher cost domestic supplier; the domestic supply curve S lies above the international supply curve P in this range of output.
Note that this example deals with a subsidy to domestic suppliers who are selling in the domestic market. It is not a subsidy to domestic producers who are selling in the international market – anexport subsidy.
- 瀏覽次數:5320
