


Elasticities are very useful pieces of evidence on economic behaviour. But we need to take care in making inferences from what we observe in market data. Upon observing price and expenditure changes in a given market, it is tempting to infer that we can immediately calculate a demand elasticity. But should we be thinking about supply elasticities? Let us look at the information needed before rushing into calculations.
In order to identify a demand elasticity we need to be sure that we have price and quantity values that lie on the same demand curve. And if we do indeed observe several price and quantity pairs that reflect a market equilibrium on a demand curve, then it must be the case that those combinations are caused by a shifting supply curve. Consider Figure 4.10. Suppose that we observe a series of prices and accompanying quantities traded in three consecutive months, and we plot these combinations to yield points A, B, C in panel (a) of the figure. If these points are market equilibria, and if they lie on the same demand curve, it must be the case that the supply curve has shifted. That is, if we can draw a single demand curve through these points, as in panel (b), the only way that they each reflect demand conditions is for the supply curve to have shifted to create these points as equilibria in the market.
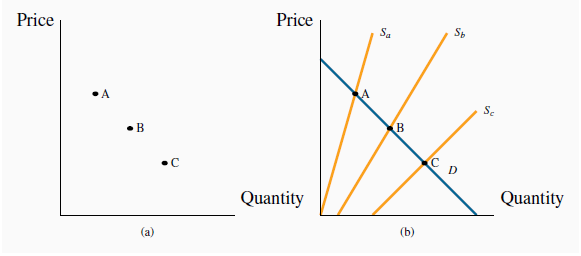
In order to establish that points such as A, B and C in panel (a) lie on the same demand curve, we must know that the supply curve alone has shifted in such a way as to result in these equilibrium price-quantity combinations, as illustrated in panel (b).
Exactly the same logic holds if we can infer that market equilibrium points all lie on the same supply curve. In that case the demand curve must have shifted in order to be able to identify the points as belonging to the supply curve.
This challenge is what we call the identification problem in econometrics. Frequently new combinations of price and quantity reflect shifts in both the supply curve and demand curve, and we need to call upon the econometricians to tell us what shifts are taking place in the market.
KEY TERMS
Price elasticity of demand is measured as the percentage change in quantity demanded, divided by the percentage change in price.
Arc elasticity of demand defines consumer responsiveness over a segment or arc of the demand curve.
Point elasticity of demand is the elasticity computed at a particular point on the demand curve.
Demand is elastic if the price elasticity is greater than unity. It is inelastic if the value lies between unity and 0. It is unit elastic if the value is exactly one.
Cross-price elasticity of demand is the percentage change in the quantity demanded of a product divided by the percentage change in the price of another.
Income elasticity of demand is the percentage change in quantity demanded divided by a percentage change in income.
Luxury good or service is one whose income elasticity exceeds unity.
Necessity is one whose income elasticity is less than unity.
Inferior goods have a negative income elasticity.
Elasticity of supply is defined as the percentage change in quantity supplied divided by the percentage change in price.
Tax Incidence describes how the burden of a tax is shared between buyer and seller.
EXERCISES
- Consider the information in the table below that describes the demand for movie rentals from your on-line supplier Instant Flicks.
Price per movie ($) Quantity demanded Total revenue Elasticity of demand 2 1200 3 1100 4 1000 5 900 6 800 7 700 8 600 - Either on graph paper or a spreadsheet, map out the demand curve.
- In column 3, insert the total revenue generated at each price.
- At what price is total revenue maximized?
- In column 4, compute the elasticity of demand corresponding to each $1 price reduction, using the average price and quantity at each state.
- Do you see a connection between your answers in parts (c) and (d)?
- Your fruit stall has 100 ripe bananas that must be sold today. Your supply curve is therefore vertical. From past experience, you know that these 100 bananas will all be sold
if the price is set at 40 cents per unit.
- Draw a supply and demand diagram illustrating the market equilibrium price and quantity.
- The demand elasticity is -0.5 at the equilibrium price. But you now discover that 10 of your bananas are rotten and cannot be sold. Draw the new supply curve and calculate the percentage price increase that will be associate with the new equilibrium, on the basis of your knowledge of the demand elasticity.
- University fees in the State of Nirvana have been frozen in real terms for 10 years. During this period enrolments increased by 20 percent.
- Draw a supply curve and two demand curves to represent the two equilibria described.
- Can you estimate a price elasticity of demand for university education in this market?
- In contrast, during the same time period fees a neighbouring state increased by 60 percent and enrolments increased by 15 percent. Illustrate this situation in a diagram.
- Consider the demand curve defined by the information in the table below.
Price of movies Quantity demanded Total revenue Elasticity of demand 2 200 3 150 4 120 5 100 - Plot the demand curve to scale and note that it is non-linear.
- Compute the total revenue at each price.
- Compute the arc elasticity of demand for each price segment.
- The demand curve for seats at the Drive-in Delight Theatre is given by P = 48 - 0.2Q. The supply of seats is given by Q = 40.
- Plot the supply and demand curves to scale, and estimate the equilibrium price.
- At this equilibrium point, calculate the elasticities of demand and supply.
- The owner has additional space in his theatre, and is considering the installation of more seats. He then remembers from his days as an economics student that this addition might not necessarily increase his total revenue. If he hired you as a consultant, would you recommend to him that he install additional seats or that he take out some of the existing seats and install a popcorn concession instead? [Hint: You can use your knowledge of the elasticities just estimated to answer this question.]
- For this demand curve, over what range of prices is demand inelastic?
- Waterson Power Corporation’s regulator has just allowed a rate increase from 9 to 11 cents per kilowatt hour of electricity. The short-run demand elasticity is -0.6 and the
long-run demand elasticity is -1.2.
- What will be the percentage reduction in power demanded in the short run?
- What will be the percentage reduction in power demanded in the long run?
- Will revenues increase or decrease in the short and long runs?
- Consider the own- and cross-price elasticity data in the table below.
% change in price CDs Magazines Cappuccinos % change in quantity CDs -0.25 0.06 0.01 Magazines -0.13 -1.20 0.27 Cappuccinos -0.07 0.41 -0.85 - For which of the goods is demand elastic and for which is it inelastic?
- What is the effect of an increase in the price of CDs on the purchase of magazines and cappuccinos? What does this suggest about the relationship between CDs and these other commodities; are they substitutes or complements?
- In graphical terms, if the price of CDs or the price of cappuccinos increases, illustrate how the demand curve for magazines shifts.
- You are responsible for running the Speedy Bus Company and have information about the elasticity of demand for bus travel: The own-price elasticity is -1.4 at the current
price. A friend who works in the competing railway company also tells you that she has estimated the cross-price elasticity of train-travel demand with respect to the price of bus travel to
be 1.7.
- As an economic analyst, would you advocate an increase or decrease in the price of bus tickets if you wished to increase revenue for Speedy?
- Would your price decision have any impact on train ridership?
- A household’s income and restaurant visits are observed at different points in time. The table below describes the pattern.
Income ($)Restaurant visitsIncome elasticity of demand
16,000 10 24,000 15 32,000 18 40,000 20 48,000 22 56,000 23 64,000 24 - Construct a scatter diagram showing quantity on the vertical axis and income on the horizontal axis.
- Is there a positive or negative relationship between these variables?
- Compute the income elasticity for each income increase, using midpoint values.
- (d) Are restaurant meals a normal or inferior good?
- Consider the following three supply curves: P = 2.25Q; P = 2+2Q; P = 6+1.5Q.
- Draw each of these supply curves to scale, and check that, at P = $18, the quantity supplied in each case is the same.
- Calculate the (point) supply elasticity for each curve at this price.
- Now calculate the same elasticities at P = $12.
- One elasticity value should be unchanged. Which one?
- The demand for bags of candy is given by P = 48 - 0.2Q, and the supply by P = Q.
- Illustrate the resulting market equilibrium in a diagram.
- If the government now puts a $12 tax on all such candy bags, illustrate on a diagram how the supply curve will change.
- Compute the new market equilibrium.
- Instead of the specific tax imposed in part (b), a percentage tax (ad valorem) equal to 30 percent is imposed. Illustrate how the supply curve would change.
- Compute the new equilibrium.
- Consider the demand curve P = 100-2Q. The supply curve is given by P = 30.
- Draw the supply and demand curves to scale and compute the equilibrium price and quantity in this market.
- If the government imposes a tax of $10 per unit, draw the new equilibrium and compute the new quantity traded and the amount of tax revenue generated.
- Is demand elastic or inelastic in this price range?
- In the preceding question: As an alternative to shifting the supply curve, try shifting the demand curve to reflect the $10 tax being imposed on the consumer.
- Solve again for the price that the consumer pays, the price that the supplier receives and the tax revenue generated.
- Compare your answers with the previous question; they should be the same.
- The supply of Henry’s hamburgers is given by P = 2+0.5Q; demand is given by Q = 20.
- Illustrate and compute the market equilibrium.
- A specific tax of $3 per unit is subsequently imposed and that shifts the supply curve to P = 5+0.5Q. Solve for the equilibrium price and quantity after the tax.
- Who bears the burden of the tax in parts (a) and (b)?
- 6236 reads
