


Figure
5.8 describes the market for high-skill labour. With no income taxes, the equilibrium labour supply and wage rate are given by (Lo,Wo). If a tax is now imposed that reduces the gross
wage Wo to , the consequence is that less labour is supplied and
there is a net loss in surplus equal to the dollar amount
, the consequence is that less labour is supplied and
there is a net loss in surplus equal to the dollar amount  . This
is the efficiency loss associated with raising government revenue equal to
. This
is the efficiency loss associated with raising government revenue equal to  . Depending on how this money is spent, society may be willing to trade off some efficiency losses in return for redistributive
gains.
. Depending on how this money is spent, society may be willing to trade off some efficiency losses in return for redistributive
gains.
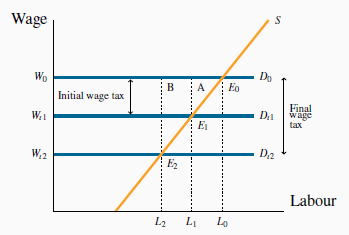
Doubling the wage tax on labour from  to
to  increases the DWL from
  to
to  . The DWL more than doubles – in this case it quadruples when the tax doubles.
Let us continue with the illustration: suppose the tax is increased further so as to reduce the net wage to  . The DWL is now
  , much larger than before. Whether we should take this extra step in sacrificing more efficiency for redistributive gains is an
ethical or normative issue. The citizens of some economies, most notably in Scandinavia, appear more willing than the citizens of the United States to make efficiency sacrifices in return for
other objectives. Canada lies between these extremes, and our major political parties can be placed clearly on a spectrum of willingness to trade equity and efficiency. A vital role for the
economist, therefore, is to clarify the nature and extent of the trade-offs. The field of public economics views this as a centrepiece in its investigations.
, much larger than before. Whether we should take this extra step in sacrificing more efficiency for redistributive gains is an
ethical or normative issue. The citizens of some economies, most notably in Scandinavia, appear more willing than the citizens of the United States to make efficiency sacrifices in return for
other objectives. Canada lies between these extremes, and our major political parties can be placed clearly on a spectrum of willingness to trade equity and efficiency. A vital role for the
economist, therefore, is to clarify the nature and extent of the trade-offs. The field of public economics views this as a centrepiece in its investigations.
KEY TERMS
Efficiency addresses the question of how well the economy’s resources are used and allocated.
Equity deals with how society’s goods and rewards are, and should be, distributed among its different members, and how the associated costs should be apportioned.
Consumer surplus is the excess of consumer willingness to pay over the market price.
Supplier or producer surplus is the excess of market price over the reservation price of the supplier.
Efficient market: maximizes the sum of producer and consumer surpluses.
Tax wedge is the difference between the consumer and producer prices.
Revenue burden is the amount of tax revenue raised by a tax.
Excess burden of a tax is the component of consumer and producer surpluses forming a net loss to the whole economy.
Deadweight loss of a tax is the component of consumer and producer surpluses forming a net loss to the whole economy.
Distortion in resource allocation means that production is not at an efficient output, or a given output is not efficiently allocated.
Externality is a benefit or cost falling on people other than those involved in the activity’s market. It can create a difference between private costs or values and social
costs or values. Corrective tax seeks to direct the market towards a more efficient output.
Greenhouse gases that accumulate excessively in the earth’s atmosphere prevent heat from escaping and lead to global warming.
Marginal damage curve reflects the cost to society of an additional unit of pollution.
Marginal abatement curve reflects the cost to society of reducing the quantity of pollution by one unit.
Tradable permits and corrective/carbon taxes are market-based systems aimed at reducing GHGs.
Horizontal equity is the equal treatment of similar individuals.
Vertical equity is the different treatment of different people in order to reduce the consequences of these innate differences.
Intergenerational equity requires a balancing of the interests and well-being of different generations and cohorts.
EXERCISES
- Four teenagers live on your street. Each is willing to shovel snow from one driveway each day. Their “willingness to shovel” valuations (supply) are: Jean, $10; Kevin, $9;
Liam, $7; Margaret, $5. Several households are interested in having their driveways shoveled, and their willingness to pay values (demand) are: Jones, $8; Kirpinsky, $4; Lafleur, $7.50;
Murray, $6.
- Draw the implied supply and demand curves as step functions.
- How many driveways will be shoveled in equilibrium?
- Compute the maximum possible sum for the consumer and supplier surpluses.
- If a new (wealthy) family arrives on the block, that is willing to pay $12 to have their driveway cleared, recompute the answers to parts (a), (b), and (c).
- Consider a market where supply and demand are given by P = 10 and P = 34 - Q respectively.
- Illustrate the market geometrically, and compute the equilibrium quantity.
- Impose a tax of $2 per unit on the good so that the supply curve is now P = 12. Calculate the new equilibrium quantity, and illustrate it in your diagram.
- Calculate the tax revenue generated, and also the deadweight loss.
- Redo the previous question with the demand curve replaced by P = 26(2/3)Q.
- Is this new demand curve more or less elastic than the original at the equilibrium?
- What do you note about the relative magnitudes of the DWL and tax revenue estimates here, relative to the previous question?
- Next, consider an example of DWL in the labour market. Suppose the demand for labour is given by the fixed gross wageW = $16. The supply is given by W = 0.8L.
- Illustrate the market geometrically.
- Calculate the equilibrium amount of labour supplied, and the supplier surplus.
- Suppose a wage tax that reduces the wage toW = $12 is imposed. By how much is the supplier’s surplus reduced at the new equilibrium?
- Governments are in the business of providing information to potential buyers. The first serious provision of information on the health consequences of tobacco use appeared in
the United States Report of the Surgeon General in 1964.
- How would you represent this intervention in a supply and demand for tobacco diagram?
- Did this intervention “correct” the existing market demand?
- In deciding to drive a car in the rush hour, you think about the cost of gas and the time of the trip.
- Do you slow down other people by driving?
- Is this an externality, given that you yourself are suffering from slow traffic?
- Suppose that our local power station burns coal to generate electricity. The demand and supply functions for electricity are given by P = 12 - 0.5Q and P = 2+0.5Q,
respectively. However, for each unit of electricity generated, there is an externality. When we factor this into the supply side of the market, the real social cost is increased, and the
supply curve is P = 3+0.5Q.
- Find the free market equilibrium and illustrate it geometrically.
- Calculate the efficient (i.e. socially optimal) level of production.
- Evan rides his mountain bike down Whistler each summer weekend. The utility value he places on each kilometre ridden is given by P = 4 - 0.02Q, where Q is the number of
kilometres. He incurs a cost of $2 per kilometre in lift fees and bike depreciation.
- How many kilometres will he ride each weekend? [Hint: Think of this “value” equation as demand, and this “cost” equation as a (horizontal) supply.]
- But Evan frequently ends up in the local hospital with pulled muscles and broken bones. On average, this cost to the Canadian taxpayer is $0.50 per kilometre ridden. From a societal viewpoint, what is the efficient number of kilometres that Evan should ride each weekend?
- Your local dry cleaner, Bleached Brite, is willing to launder shirts at its cost of $1.00 per shirt. The neighbourhood demand for this service is P = 5 - 0.005Q.
- Illustrate and compute the market equilibrium.
- Suppose that, for each shirt, Bleached Brite emits chemicals into the local environment that cause $0.25 damage per shirt. This means the full cost of each shirt is $1.25. Calculate the socially optimal number of shirts to be cleaned.
- The supply curve for agricultural labour is given by W = 6+0.1L, where W is the wage (price per unit) and L the quantity traded. Employers are willing to pay a wage of $12 to
all workers who are willing to work at that wage; hence the demand curve isW = 12.
- Illustrate the market equilibrium, and compute the equilibrium wage (price) and quantity of labour employed.
- Compute the supplier surplus at this equilibrium.
- The demand for ice cream is given by P = 24 - Q and the supply curve by P = 4.
- Illustrate the market equilibrium, and compute the equilibrium price and quantity.
- Calculate the consumer surplus at the equilibrium.
- As a result of higher milk prices to dairy farmers the supply conditions change to P=6. Compute the new quantity traded, and calculate the loss in consumer surplus.
- Two firms A and B, making up a sector of the economy, emit pollution (pol) and have marginal abatement costs:
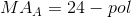 and
and 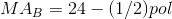 . So the total abatement curve for this sector is given by
 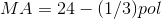 . The marginal damage function is constant at a value of $12 per unit of pollution
emitted: MD = $12.
. The marginal damage function is constant at a value of $12 per unit of pollution
emitted: MD = $12.
- Draw the MD and market-level MA curves and establish the efficient level of pollution for this economy.
- In the preceding question, if each firm is permitted to emit half of the efficient level of pollution, illustrate your answer in a diagram which contains the
 and
and  curves.
- With each firm producing this amount of pollution, how much would it cost each one to reduce pollution by one unit?
- If these two firms can freely trade the right to pollute, how many units will they (profitably) trade?
- Once again, in the previous question, suppose that the government’s policy is to allow firms to pollute provided that they purchase a permit valued at $10 per unit emitted
(rather than allocating a pollution quota to each firm).
- How many units of pollution rights would be purchased and by the two participants in this market?
- The market demand for vaccine XYZ is given by P = 36 - Q and the supply conditions are P = 20. There is a positive externality associated with being vaccinated, and the real
societal value is known and given by P = 36(1/2)Q.
- What is the market solution to this supply and demand problem?
- What is the socially optimal number of vaccinations?
- If we decide to give the supplier a given dollar amount per vaccination supplied in order to reduce price and therefore increase the number of vaccinations to the social optimum, what would be the dollar value of that per-unit subsidy?
- In the preceding question, suppose that we give buyers the subsidy instead of giving it to the suppliers. By how much would the demand curve have to shift upward in order that the socially optimal quantity is realized?
- The demand and supply curves in a regular market (no externalities) are given by P=42 - Q and P = 0.2Q.
- Solve for the equilibrium price and quantity.
- A percentage tax of 100% is now levied on each unit supplied. Hence the form of the new supply curve P = 0.4Q. Find the new market price and quantity.
- How much per unit is the supplier paid?
- Compute the producer and consumer surpluses after the imposition of the tax and also the DWL.
- 3618 reads
