


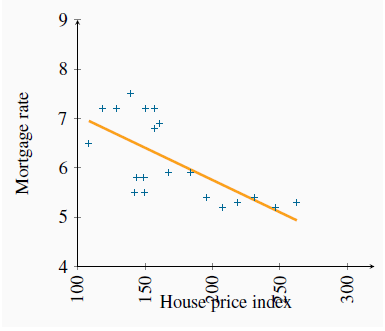
A line through the scatter of points in Figure 2.5 shows the average relationship between mortgage rates and house prices. A challenge is to define the line that most accurately characterizes the relationship. This task is the job of econometricians, who practice econometrics. Econometrics is the science of examining and quantifying relationships between economic variables. It attempts to determine the separate influences of each variable, in an environment where many things move simultaneously.
 Econometrics is the science of examining and
quantifying relationships between economic variables.
Econometrics is the science of examining and
quantifying relationships between economic variables.
In two dimensions, the line drawn through the scatter is chosen to minimize the sum of distances (or distances squared) between the line and the various points. It is called a regression line or a trend line if the data are in time-series form. Computer algorithms that do this are plentiful, and fortunately computers can work in many dimensions in order to capture the influences of all the variables simultaneously 1 .
 Regression line: representation of the average
relationship between two variables in a scatter diagram.
Regression line: representation of the average
relationship between two variables in a scatter diagram.
| Year, quarter | 5-year conventional mortgage rate | Resale house price index 2006q4 = 100 |
| 2007Q1 | 6.5 | 108.4 |
| 2007Q2 | 7.2 | 118.4 |
| 2007Q3 | 7.2 | 128.7 |
| 2007Q4 | 7.5 | 139.4 |
| 2008Q1 | 7.2 | 150.5 |
| 2008Q2 | 7.2 | 157.1 |
| 2008Q3 | 6.9 | 160.9 |
| 2008Q4 | 6.8 | 157.2 |
| 2009Q1 | 5.8 | 149.2 |
| 2009Q2 | 5.8 | 143.4 |
| 2009Q3 | 5.5 | 142.2 |
| 2009Q4 | 5.5 | 149.9 |
| 2010Q1 | 5.9 | 167.3 |
| 2010Q2 | 5.9 | 183.7 |
| 2010Q3 | 5.4 | 195.4 |
| 2010Q4 | 5.2 | 207.5 |
| 2011Q1 | 5.3 | 218.5 |
| 2011Q2 | 5.4 | 231.0 |
| 2011Q3 | 5.2 | 246.9 |
| 2011Q4 | 5.3 | 262.5 |
Source: Mortgage rate: Statistics Canada, CANSIM Series V122521; Resale Housing Price index: www.royallepage.com, and authors’ calculations
- 2743 reads
