


In macroeconomics, our data come to us in the form of time series. Time series are a sequence of dated variables: GDP in 2000, GDP in 2001, GDP in 2002, and so on. Usually these data are annual, but they could also be quarterly or monthly (or even daily or hourly). If we go to the Economic Report of the President(http://www.gpoaccess.gov/eop), we can find data for nominal GDP. In the United States, the Bureau of Economic Analysis (BEA; http://www.bea.gov/national/index.htm) in the Department of Commerce is responsible for calculating nominal GDP. Table 3.2 Nominal GDP in the United States, 2000–201 gives an example of a time series.
|
Year |
Nominal GDP (Billions of Dollars) |
|
2000 |
9,951.5 |
|
2001 |
10,286.2 |
|
2002 |
10,642.3 |
|
2003 |
11,142.1 |
|
2004 |
11,867.8 |
|
2005 |
12,638.4 |
|
2006 |
13,398.9 |
|
2007 |
14,061.8 |
|
2008 |
14,369.1 |
|
2009 |
14,119.0 |
|
2010 |
14,660.2 |
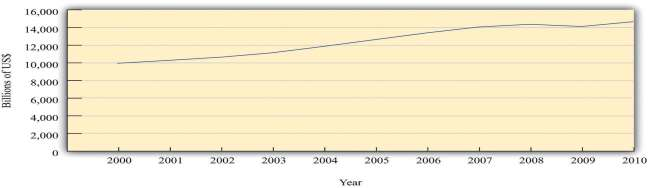
It is often more revealing to show a time series as a picture rather than a list of numbers. Figure 3.3 Nominal GDP in the United States, 2000–2010 shows the data from Table 3.2 Nominal GDP in the United States, 2000–201 in a graph. Looking at this figure, we see immediately that the US economy grew over these years. The level of nominal GDP (in billions) was $9.8 trillion in 2000 and $13.2 trillion in 2006.
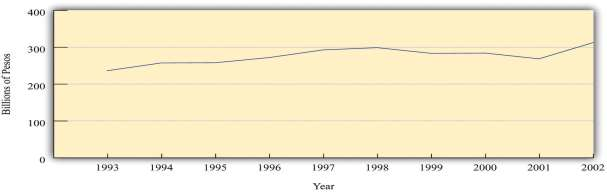
Let us return to your International Monetary Fund (IMF) mission in Argentina. From talking to other members of the team, you learn that the Argentine government has statistics on nominal GDP. This is good news, for it means you do have information on the total value of production in the economy. Figure 3.4 Nominal GDP in Argentina, 1993–2002 shows nominal GDP for Argentina over the decade prior to your arrival (1993–2002). In 1993, it was 237 billion pesos. In 2002, it was 313 billion pesos. Thus nominal GDP grew by about one-third over the course of the decade.
Now suppose that in your hotel room one morning you hear on the radio that government statisticians in Argentina forecast that nominal GDP next year will be 300 million pesos greater than this year. How should you interpret this news? Without some context, it is difficult to make any judgment at all.
The first thing to do is to work out if 300 million pesos is a big number or a small number. It certainly sounds like a big number or looks like a big number if we write it out in full (300,000,000). If we stacked 300 million peso bills on top of each other, the pile would be over 100 miles high. But the real question is whether this is a big number relative to existing nominal GDP. We have been told that the change in nominal GDP is 300 million, but we would like to know what this is as a growth rate, which is a percentage change.
Toolkit: Section 16.11 "Growth Rates"
A growth rate is a percentage change in a variable from one year to the next. That is, a growth rate is the change in a variable over time divided by its value in the beginning period.
For example, the growth rate of GDP is calculated as follows:
In our example for Argentina, the percentage change is equal to the change in nominal GDP divided by its initial value. Remember than nominal GDP in 2002 was about 300 billion pesos, so

When we express this change in nominal GDP as a percentage, therefore, we see that it is in fact very small—one-tenth of 1 percent. If you heard on the radio that nominal GDP was expected to grow by 300 million pesos in a 300-billion peso economy, the correct conclusion would be that nominal GDP would hardly change at all. By contrast, if the news announced a projected increase in nominal GDP of 30 billion pesos, the percentage change is 30 billion/300 billion = 0.1 = 10 percent. This is a substantial change in nominal GDP.
- 2438 reads
