


We now put the market demand and market supply curves together to give us the supply-anddemand picture in ***Figure 4.5 "Market Equilibrium". The point where supply and demand meet is the equilibrium in the market. At this point, there is a perfect match between the amount that buyers want to buy and the amount that sellers want to sell.
Toolkit: Section 16.6 "Supply and Demand"
Equilibrium in a market refers to an equilibrium price and an equilibrium quantity and has the following features:
- Given the equilibrium price, sellers supply the equilibrium quantity.
- Given the equilibrium price, buyers demand the equilibrium quantity.
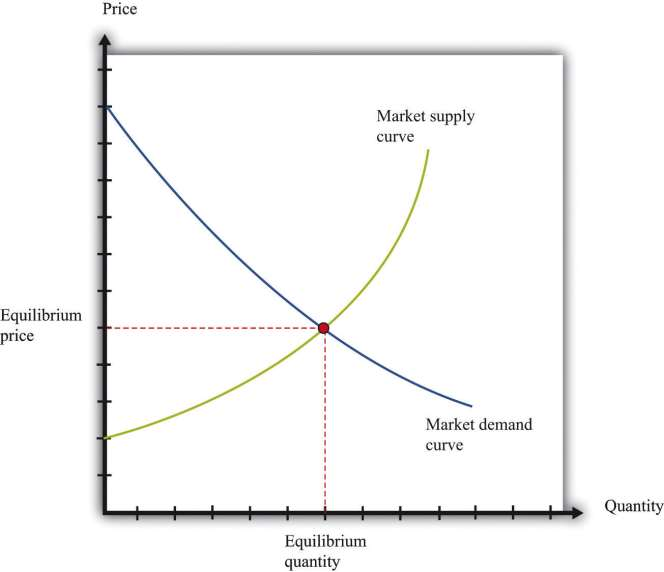
We speak of equilibrium because there is a balancing of the forces of supply and demand in the market. At the equilibrium price, suppliers of the good can sell as much as they wish, and demanders of the good can buy as much of the good as they wish. There are no disappointed buyers or sellers. Because the demand curve has a negative slope and the supply curve has a positive slope, supply and demand will cross once, and both equilibrium price and equilibrium quantity will be positive.
***Table 4.1 "Market Equilibrium: An Example" provides an example of market equilibrium. It gives market supply and market demand for four different prices. Equilibrium occurs at a price of $100,000 and a quantity of 50 new houses.
Table 4.1 Market Equilibrium: An Example
|
Price ($) |
Market Supply |
Market Demand |
|
10,000 |
5 |
95 |
|
50,000 |
25 |
75 |
|
100,000 |
50 |
50 |
|
200,000 |
100 |
0 |
Economists typically believe that a perfectly competitive market is likely to reach equilibrium. The reasons for this belief are as follows:
- If price is different from the equilibrium price, then there will be an imbalance between demand and supply. This gives buyers and sellers an incentive to behave differently. For example, if price is less than the equilibrium price, demand will exceed supply. Disappointed buyers might start bidding up the price, or sellers might realize they could charge a higher price. The opposite is true if the price is too high: suppliers might be tempted to try cutting prices, while buyers might look for better deals.
- There is strong support for market predictions in the evidence from experimental markets. When buyers and sellers meet individually and bargain over prices, we typically see an outcome very similar to the market outcome in Figure 4.5 "Market Equilibrium".
- The supply-and-demand framework generally provides reliable predictions about the movement of prices.
Pictures like ***Figure 4.5 "Market Equilibrium" are useful to help understand how the market works. Keep in mind, however, that firms and households in the market do not need any of this information. This is one of the beauties of the market. All an individual firm or household needs to know is the prevailing market price. All the coordination occurs through the workings of the market.
KEY TAKEAWAY
The primary factor influencing demand for housing is the price of housing. By the law of demand, as price decreases, the quantity of housing demanded increases. The demand for housing also depends on the wealth of households, their current income, and interest rates.
The primary factor influencing supply of housing is the price of housing. As price increases, the quantity supplied also increases. The supply of housing is shifted by changes in the price of inputs and changes in technology.
The quantity and price of housing traded is determined by the equilibrium of the housing market.
***
Checking Your Understanding
What would be the impact of a decrease in the cost of borrowing on the market supply curve of housing? What would be the impact of a decrease in the cost of borrowing on the market demand curve?
Name two events that would cause the housing market supply curve to shift rightward. Name two events that would cause the housing market demand curve to shift rightward.
- 11493 reads
