


Descriptive research is designed to create a snapshot of the current thoughts, feelings, or behavior of individuals. This section reviews three types of descriptive research: case studies, surveys, and naturalistic observation.
Sometimes the data in a descriptive research project are based on only a small set of individuals, often only one person or a single small group. These research designs are known as case studies—descriptive records of one or more individual’s experiences and behavior. Sometimes case studies involve ordinary individuals, as when developmental psychologist Jean Piaget used his observation of his own children to develop his stage theory of cognitive development. More frequently, case studies are conducted on individuals who have unusual or abnormal experiences or characteristics or who find themselves in particularly difficult or stressful situations. The assumption is that by carefully studying individuals who are socially marginal, who are experiencing unusual situations, or who are going through a difficult phase in their lives, we can learn something about human nature.
Sigmund Freud was a master of using the psychological difficulties of individuals to draw conclusions about basic psychological processes. Freud wrote case studies of some of his most interesting patients and used these careful examinations to develop his important theories of personality. One classic example is Freud’s description of “Little Hans,” a child whose fear of horses the psychoanalyst interpreted in terms of repressed sexual impulses and the Oedipus complex (Freud (1909/1964). 1
Another well-known case study is Phineas Gage, a man whose thoughts and emotions were extensively studied by cognitive psychologists after a railroad spike was blasted through his skull in an accident. Although there is question about the interpretation of this case study (Kotowicz, 2007), 2 it did provide early evidence that the brain’s frontal lobe is involved in emotion and morality (Damasio et al., 2005). 3 An interesting example of a case study in clinical psychology is described by Rokeach (1964), 4 who investigated in detail the beliefs and interactions among three patients with schizophrenia, all of whom were convinced they were Jesus Christ.
In other cases the data from descriptive research projects come in the form of a survey—a measure administered through either an interview or a written questionnaire to get a picture of the beliefs or behaviors of a sample of people of interest. The people chosen to participate in the research (known as the sample) are selected to be representative of all the people that the researcher wishes to know about (the population). In election polls, for instance, a sample is taken from the population of all “likely voters” in the upcoming elections.
The results of surveys may sometimes be rather mundane, such as “Nine out of ten doctors prefer Tymenocin,” or “The median income in Montgomery County is $36,712.” Yet other times (particularly in discussions of social behavior), the results can be shocking: “More than 40,000 people are killed by gunfire in the United States every year,” or “More than 60% of women between the ages of 50 and 60 suffer from depression.” Descriptive research is frequently used by psychologists to get an estimate of the prevalence (or incidence) of psychological disorders.
A final type of descriptive research—known as naturalistic observation—is research based on the observation of everyday events. For instance, a developmental psychologist who watches children on a playground and describes what they say to each other while they play is conducting descriptive research, as is a biopsychologist who observes animals in their natural habitats. One example of observational research involves a systematic procedure known as the strange situation, used to get a picture of how adults and young children interact. The data that are collected in the strange situation are systematically coded in a coding sheet such as that shown in Table 2.3.
|
Coder name: Olive |
||||
|
|
Coding categories | |||
|
Episode |
Proximity |
Contact |
Resistance |
Avoidance |
|
Mother and baby play alone |
1 |
1 |
1 |
1 |
|
Mother puts baby down |
4 |
1 |
1 |
1 |
|
Stranger enters room |
1 |
2 |
3 |
1 |
|
Mother leaves room; stranger plays with baby |
1 |
3 |
1 |
1 |
|
Mother reenters, greets and may comfort baby, then leaves again |
4 |
2 |
1 |
2 |
|
Stranger tries to play with baby |
1 |
3 |
1 |
1 |
|
Mother reenters and picks up baby |
6 |
6 |
1 |
2 |
|
Coding categories explained |
||||
|
Proximity |
The baby moves toward, grasps, or climbs on the adult. |
|||
|
Maintaining contact |
The baby resists being put down by the adult by crying or trying to climb back up. |
|||
|
Resistance |
The baby pushes, hits, or squirms to be put down from the adult’s arms. |
|||
|
Avoidance |
The baby turns away or moves away from the adult. |
|||
|
This table represents a sample coding sheet from an episode of the “strange situation,” in which an infant (usually about 1 year old) is observed playing in a room with two adults—the child’s mother and a stranger. Each of the four coding categories is scored by the coder from 1 (the baby makes no effort to engage in the behavior) to 7 (the baby makes a significant effort to engage in the behavior). More information about the meaning of the coding can be found in Ainsworth, Blehar, Waters, and Wall (1978). 5 |
||||
The results of descriptive research projects are analyzed using descriptive statistics—numbers that summarize the distribution of scores on a measured variable. Most variables have distributions similar to that shown in Figure 2.3, where most of the scores are located near the center of the distribution, and the distribution is symmetrical and bell- shaped. A data distribution that is shaped like a bell is known as anormal distribution.
|
Student name |
Height in inches |
Family income in dollars |
|
Lauren |
62 |
48,000 |
|
Courtnie |
62 |
57,000 |
|
Leslie |
63 |
93,000 |
|
Renee |
64 |
107,000 |
|
Katherine |
64 |
110,000 |
|
Jordan |
65 |
93,000 |
|
Rabiah |
66 |
46,000 |
|
Alina |
66 |
84,000 |
|
Young Su |
67 |
68,000 |
|
Martin |
67 |
49,000 |
|
Hanzhu |
67 |
73,000 |
|
Caitlin |
67 |
3,800,000 |
|
Steven |
67 |
107,000 |
|
Emily |
67 |
64,000 |
|
Amy |
68 |
67,000 |
|
Jonathan |
68 |
51,000 |
|
Julian |
68 |
48,000 |
|
Alissa |
68 |
93,000 |
|
Christine |
69 |
93,000 |
|
Candace |
69 |
111,000 |
|
Xiaohua |
69 |
56,000 |
|
Charlie |
70 |
94,000 |
|
Timothy |
71 |
73,000 |
|
Ariane |
72 |
70,000 |
|
Logan |
72 |
44,000 |
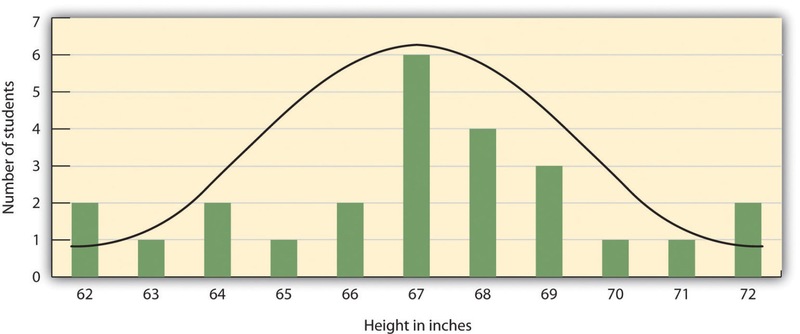
A distribution can be described in terms of its central tendency—that is, the point in the distribution around which the data are centered—and its dispersion, or spread. The arithmetic average, or arithmetic mean, is the most commonly used measure of central tendency. It is computed by calculating the sum of all the scores of the variable and dividing this sum by the number of participants in the distribution (denoted by the letter N). In the data presented in Figure 2.3, the mean height of the students is 67.12 inches. The sample mean is usually indicated by the letter M.
In some cases, however, the data distribution is not symmetrical. This occurs when there are one or more extreme scores (known as outliers) at one end of the distribution. Consider, for instance, the variable of family income (see Figure 2.4), which includes an outlier (a value of $3,800,000). In this case the mean is not a good measure of central tendency. Although it appears from Figure 2.4 that the central tendency of the family income variable should be around $70,000, the mean family income is actually $223,960. The single very extreme income has a disproportionate impact on the mean, resulting in a value that does not well represent the central tendency.
The median is used as an alternative measure of central tendency when distributions are not symmetrical. The median is the score in the center of the distribution, meaning that 50% of the scores are greater than the median and 50% of the scores are less than the median. In our case, the median household income ($73,000) is a much better indication of central tendency than is the mean household income ($223,960).
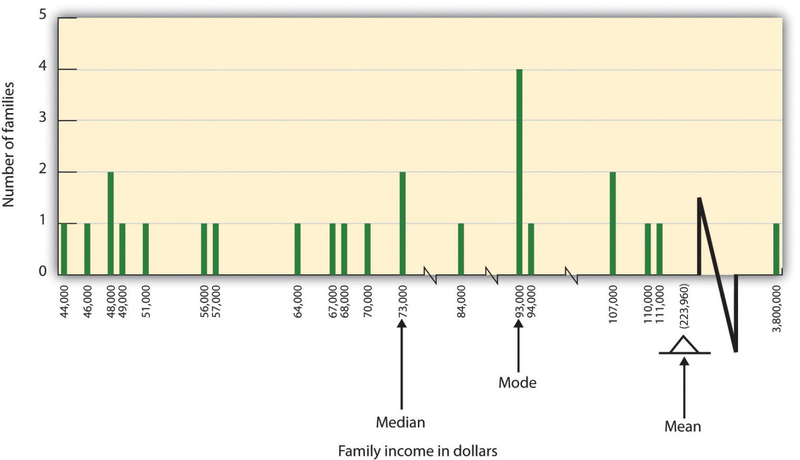
A final measure of central tendency, known as the mode, represents the value that occurs most frequently in the distribution. You can see from Figure 2.4 that the mode for the family income variable is $93,000 (it occurs four times).
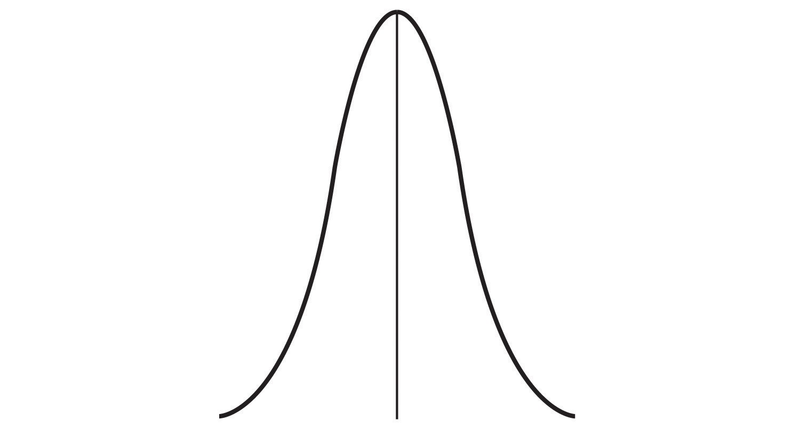
In addition to summarizing the central tendency of a distribution, descriptive statistics convey information about how the scores of the variable are spread around the central tendency. Dispersion refers to the extent to which the scores are all tightly clustered around the central tendency, like this:
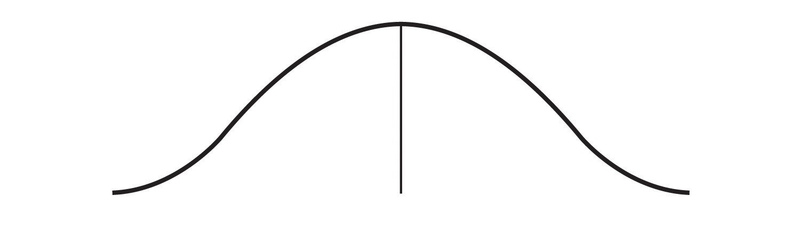
Or they may be more spread out away from it, like this:
One simple measure of dispersion is to find the largest (the maximum) and the smallest (the minimum) observed values of the variable and to compute the range of the variable as the maximum observed score minus the minimum observed score. You can check that the range of the height variable in Figure 2.3 is 72 – 62 = 10. The standard deviation, symbolized as s, is the most commonly used measure of dispersion. Distributions with a larger standard deviation have more spread. The standard deviation of the height variable is s = 2.74, and the standard deviation of the family income variable is s = $745,337.
An advantage of descriptive research is that it attempts to capture the complexity of everyday behavior. Case studies provide detailed information about a single person or a small group of people, surveys capture the thoughts or reported behaviors of a large population of people, and naturalistic observation objectively records the behavior of people or animals as it occurs naturally. Thus descriptive research is used to provide a relatively complete understanding of what is currently happening.
Despite these advantages, descriptive research has a distinct disadvantage in that, although it allows us to get an idea of what is currently happening, it is usually limited to static pictures. Although descriptions of particular experiences may be interesting, they are not always transferable to other individuals in other situations, nor do they tell us exactly why specific behaviors or events occurred. For instance, descriptions of individuals who have suffered a stressful event, such as a war or an earthquake, can be used to understand the individuals’ reactions to the event but cannot tell us anything about the long-term effects of the stress. And because there is no comparison group that did not experience the stressful situation, we cannot know what these individuals would be like if they hadn’t had the stressful experience.
- 4722 reads
