


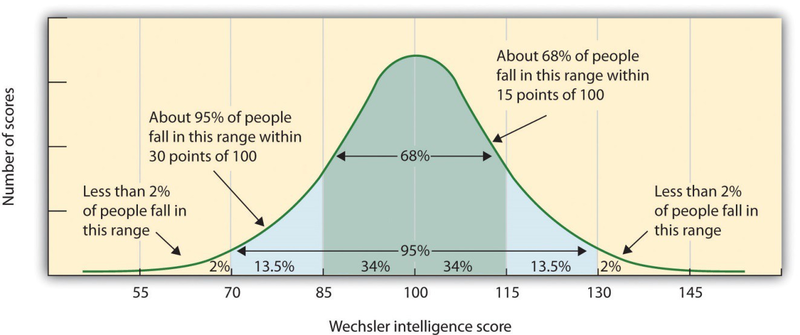
The results of studies assessing the measurement of intelligence show that IQ is distributed in the population in the form of anormal distribution (or bell curve), which is thepattern of scores usuallyobserved in a variablethat clusters around its average. In a normal distribution, the bulk of the scores fall toward the middle, with many fewer scores falling at the extremes. The normal distribution of intelligence ( Figure 9.3) shows that on IQ tests, as well as on most other measures, the majority of people cluster around the average ( in this case, where IQ = 100), and fewer are either very smart or very dull. Because the standard deviation of an IQ test is about 15, this means that about 2% of people score a bove an IQ of 130 (often considered the threshold forgiftedness), and about the same percentage score below an IQ of 70 (often being considered the threshold for mental retardation).
Although Figure 9.3 presents a single distribution, the actual IQ distribution varies by sex such that the distribution for men is more spread out than is the distribution for women. These sex differences mean that about 20% more men than women fall in the extreme (very smart or very dull) e nds of the distribution (Johnson, Carothers, & Deary, 2009). 1 Boys are a bout five times more likely to be diagnosed with the reading disability dyslexia than are girls (Halpern, 1992), 2 and are also more likely to be classified as mentally retarded. But boys are also about 20% more highly represented in the upper end of the IQ distribution.
- 41119 reads
