


It is important in economic analysis to discuss and interpret data in a meaningful manner. Index numbers help us greatly in doing this. They are values of a given variable, or an average of a set of variables expressed relative to a base value. The key characteristics of indexes are that they are not dependent upon the units of measurement of the data in question, and they are interpretable easily with reference to a given base value. To illustrate, let us change the price data in column 2 of Table 2.1 into index number form.
 Index number: value for a variable, or an
average of a set of variables, expressed relative to a given base value.
Index number: value for a variable, or an
average of a set of variables, expressed relative to a given base value.
The first step is to choose a base year as a reference point. This could be any one of the periods. We will simply take the first period as the year and set the price index value equal to 100 in that year. The value of 100 is usually chosen in order to make comparisons simple, but in some cases a base year value of 1.0 is used. If the base year value of 100 is used, the value of index in any year t is:
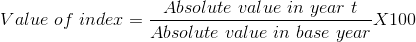
(2.2)
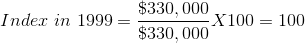
Suppose we choose 1999 as the base year for constructing an index of the house prices given in Table 2.1 House prices in that year were $330,000. Then the index for the base year has a value:
Applying the method to each value in column 2 yields column 3, which is now in index number form. For example, the January 2003 value is:
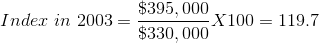
Each value in the index is interpreted relative to the value of 100, the base price in January 1999. The beauty of this column lies first in its ease of interpretation. For example, by 2003 the price increased to 119.7 points relative to a value of 100. This yields an immediate interpretation: The index has increased by 19.7 points per hundred or percent. While it is particularly easy to compute a percentage change in a data series when the base value is 100, it is not necessary that the reference point have a value of 100. By definition, a percentage change is given by the change in values relative to the initial value, multiplied by 100. For example, the percentage change in the price from 2006 to 2007, using the price index is: (190.91-175.76)/175.76X 100 = 8.6 percent
 Percentage change = (change in values) = original
value X 100.
Percentage change = (change in values) = original
value X 100.
Furthermore, index numbers enable us to make comparisons with the price patterns for other goods much more easily. If we had constructed a price index for wireless phones, which also had a base value of 100 in 1999, we could make immediate comparisons without having to compare one set of numbers defined in dollars with another defined in tens of thousands of dollars. In short, index numbers simplify the interpretation of data.
- 2123 reads
