


Index numbers have even wider uses than those we have just described. Suppose you are interested in the price trends for all fuels as a group in Canada during the last decade. You know that this group includes coal, natural gas, and oil, but you suspect that these components have not all been rising in price at the same rate. You also know that, while these fuels are critical to the economy, some play a bigger role than others, and therefore should be given more importance, or weight, in a general fuel price index. In fact, the official price index for these fuels is a weighted average of the component price indexes. The fuels that are more important get a heavier weighting in the overall index. For example, if oil accounts for 60 percent of fuel use, natural gas for 25 percent, and coal for 15 percent, the price index for fuel could be computed as follows:
Fuel price index = (oil index X 0.6)+(natural gas index X 0.25)+(coal index X 0.15)
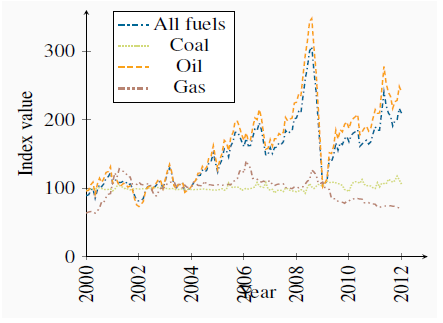
To illustrate this, Figure 2.4 presents the price trends for these three fuels. The data come from Statistics Canada’s CANSIM database. In addition, the overall fuel price index is plotted. It is frequently the case that components do not display similar patterns, and in this instance the composite index follows oil most closely, reflecting the fact that oil has the largest weight.
- 2213 reads
