


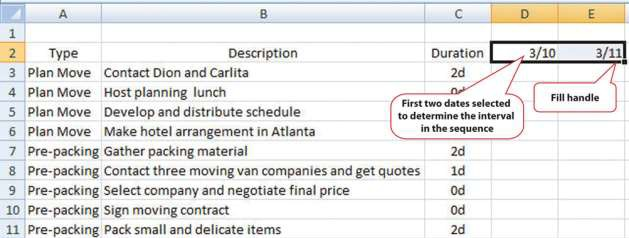
Spreadsheets can be used for basic progress reports that show activities, dates, and horizontal bars that represent the duration of an activity. A sequence of dates can be created as column labels by entering the first two dates in the sequence, selecting both dates, and then dragging the fill handle—a small square in the lower right corner of the selected cell, as shown in Figure 6.20—to extend the pattern.
The program is sophisticated enough to correctly fill date sequences between months that have a different number of days and even account for leap years in February. Because more sophisticated project management software uses a table design in which the first two columns are description and duration, a similar structure, in which those two columns are adjacent and in that order will make it convenient to transfer the list of activities in a low-complexity project into the project management software at a later date if the spreadsheet is not sufficient. In the duration column, use the following abbreviations:
- d for days
- wk for weeks
- mons for months
The duration of each activity and the relationships between activities can be illustrated using the drawing shapes. In Excel 2007, the same set of shapes and connector arrows are available as those in Word 2007. A long rectangle can represent a bar whose length represents the duration of the activity. Events or significant dates in the project are identified with a diamond. The diamond can be created by using a small square shape and rotating it. Arrows can be drawn between the shapes to indicate their relationships, as shown in Figure 6.21. Unfortunately, the arrows in Excel 2007 connect to handles on the sides of the rotated squares instead of the corners. This detail may be overlooked in a simple project diagram.
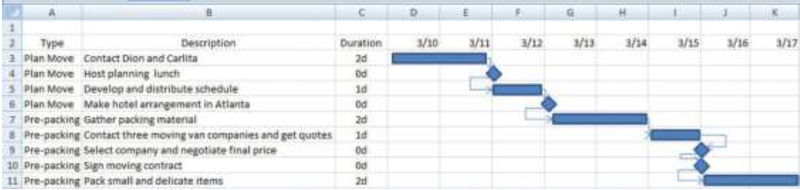
This type of diagram is useful for projects with low complexity where a simple chart of a few activities will suffice.
- 2077 reads
