


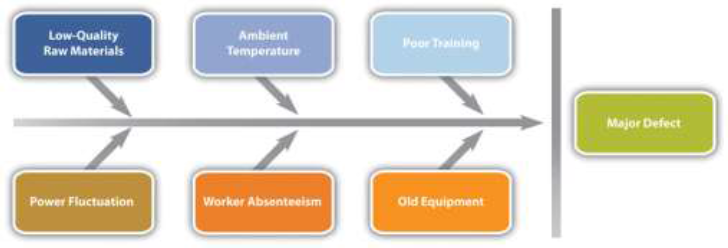
When control charts indicate an assignable cause for a variation, it is not always easy to identify the cause of a problem. Discussions that are intended to discover the cause can be facilitated using a cause-and-effect or fishbone diagram where participants are encouraged to identify possible causes of a defect.
Diagramming Quality Problems
For example, a small manufacturing firm tries to identify the assignable causes to variations in its manufacturing line. They assemble a team that identifies six possibilities, as shown in Figure 10.9.
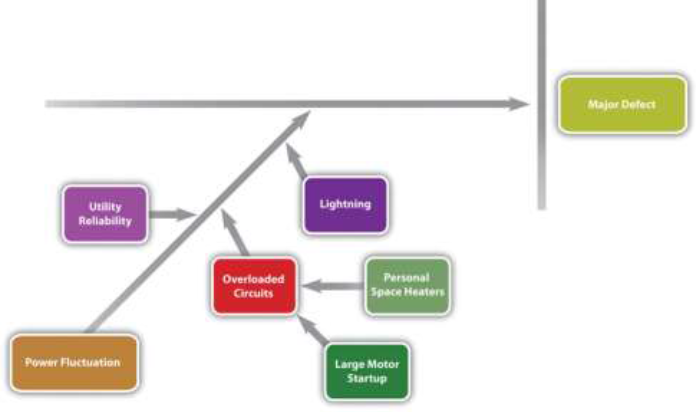
An engineer and the electrician work on one of the branches to consider possible causes of power fluctuation and add detail to their part of the fishbone diagram, as shown in Figure 10.10.
- 3517 reads
