


Managers are often interested in "before and after" questions. As a manager or researcher you will often want to look at "longitudinal" studies, studies that ask about what has happened to an individual as a result of some treatment or across time. Are they different after than they were before? For example, if your firm has conducted a training program you will want to know if the workers who participated became more productive. If the work area has been re-arranged, do workers produce more than before? Though you can use the difference of means test developed earlier, this is a different situation. Earlier, you had two samples that were chosen independently of each other; you might have a sample of workers who received the training and a sample of workers who had not. The situation for this test is different; now you have a sample of workers and for each worker you have measured their productivity before the training or re-arrangement of the work space and you have measured their productivity after. For each worker you have a pair of measures, before and after. Another way to look at this is that for each member of the sample you have a difference between before and after.
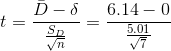
You can test to see if these differences equal zero, or any other value, because a statistic based on these differences follows the t-distribution for n-1 df when you have n matched pairs. That statistic is:

where:  = the mean of the differences in the pairs in
the sample
= the mean of the differences in the pairs in
the sample
 = the mean of the differences in the pairs in the population
 = the standard deviation of the differences in the sample
n = the number of pairs in the sample.
It is a good idea to take a minute and figure out this formula. There are paired samples and the differences in those pairs, the D's, are actually a population. The mean of those D's is
 . Any sample of pairs will also yield a sample of D's. If those
D's are normally distributed, then the t-statistic in the formula above will follow the t-distribution. If you think of the D's as the same as x's in the t-formula at the beginning of the
chapter, and think of δ as the population mean, you should realize that this formula is really just that basic t formula.
. Any sample of pairs will also yield a sample of D's. If those
D's are normally distributed, then the t-statistic in the formula above will follow the t-distribution. If you think of the D's as the same as x's in the t-formula at the beginning of the
chapter, and think of δ as the population mean, you should realize that this formula is really just that basic t formula.
Lew Podolsky is division manager for Dairyland Lighting, a manufacturer of outdoor lights for parking lots, barnyards, and playing fields. Dairyland Lighting organizes its production work by teams. The size of the team varies somewhat with the product being assembled, but there are usually three to six in a team, and a team usually stays together for a few weeks assembling the same product. Dairyland Lighting has a branch plant in the US state of Arizona that serves their west coast customers and Lew has noticed that productivity seems to be lower in Arizona during the summer, a problem that does not occur at the main plant in the US city of Green Bay, Wisconsin. After visiting the Arizona plant in July, August, and November, and talking with the workers during each visit, Lew suspects that the un-air conditioned plant just gets too hot for good productivity. Unfortunately, it is difficult to directly compare plant-wide productivity at different times of the year because there is quite a bit of variation in the number of employees and product mix across the year. Lew decides to see if the same workers working on the same products are more productive on cool days than hot days by asking the local manager, Dave Mueller, to find a cool day and a hot day from last fall and choose ten work teams who were assembling the same products on the two days. Dave sends Lew the following data:
| Team leader | Output—cool day | Output—hot day | Difference (cool-hot) |
| October 14 | October 20 | ||
| Martinez | 153 | 149 | 4 |
| McAlan | 167 | 170 | -3 |
| Wilson | 164 | 155 | 9 |
| Burningtree | 183 | 179 | 4 |
| Sanchez | 177 | 167 | 10 |
| Lilly | 162 | 150 | 12 |
| Cantu | 165 | 158 | 7 |
Lew decides that if the data support productivity being higher of cool days, he will call in a heating/airconditioning contractor to get some cost estimates so that he can decide if installing air conditioning in the Arizona plant is cost-effective. Notice that he has matched pairs data--for each team he has production on October 14, a cool day, and on October 20, a hot day. His hypotheses are:
 and
and 
Using  in this one-tail test, Lew will decide to call the
engineer if his sample t-score is greater than 1.943, since there are 6 df. This sample is small, so it is just as easy to do the computations on a calculator. Lew finds:
in this one-tail test, Lew will decide to call the
engineer if his sample t-score is greater than 1.943, since there are 6 df. This sample is small, so it is just as easy to do the computations on a calculator. Lew finds:


and his sample t-score is:
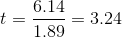
Because his sample t-score is greater than 1.943, Lew gets out the telephone book and looks under air conditioning contractors to call for some estimates.
- 1584 reads
