


Years ago, statisticians discovered that when pairs of samples are taken from a normal population, the ratios of the variances of the samples in each pair will always follow the same distribution. Not surprisingly, over the intervening years, statisticians have found that the ratio of sample variances collected in a number of different ways follow this same distribution, the F-distribution. Because we know that sampling distributions of the ratio of variances follow a known distribution, we can conduct hypothesis tests using the ratio of variances.
The F-statistic is simply:

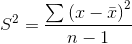
where si2 is the variance of sample i. Remember that the sample variance is:
Think about the shape that the F-distribution will have. If  and
and  come from samples from the same population, then if many pairs of samples were taken and F-scores computed, most of those F-scores
would be close to one. All of the F-scores will be positive since variances are always positive—the numerator in the formula is the sum of squares, so it will be positive, the denominator is
the sample size minus one, which will also be positive. Thinking about ratios requires some care. If
come from samples from the same population, then if many pairs of samples were taken and F-scores computed, most of those F-scores
would be close to one. All of the F-scores will be positive since variances are always positive—the numerator in the formula is the sum of squares, so it will be positive, the denominator is
the sample size minus one, which will also be positive. Thinking about ratios requires some care. If  is a lot larger than
  , F can be quite large. It is equally possible for
  to be a lot larger than
  , and then F would be very close to zero. Since F goes from zero to very large, with most of the values around one, it is
obviously not symmetric; there is a long tail to the right, and a steep descent to zero on the left.
, and then F would be very close to zero. Since F goes from zero to very large, with most of the values around one, it is
obviously not symmetric; there is a long tail to the right, and a steep descent to zero on the left.
There are two uses of the F-distribution which will be discussed in this chapter. The first is a very simple test to see if two samples come from populations with the same variance. The second is one-way Analysis Of Variance (ANOVA) which uses the F-distribution to test to see if three or more samples come from populations with the same mean.
- 2009 reads
