


The quantity supplied of a good or service is the quantity sellers are willing to sell at a particular price during a particular period, all other things unchanged. Ceteris paribus, the receipt of a higher price increases profits and induces sellers to increase the quantity they supply.
In general, when there are many sellers of a good, an increase in price results in an increase in quantity supplied, and this relationship is often referred to as the law of supply. We will see, though, through our exploration of microeconomics, that there are a number of exceptions to this relationship. There are cases in which a higher price will not induce an increase in quantity supplied. Goods that cannot be produced, such as additional land on the corner of Park Avenue and 56th Street in Manhattan, are fixed in supply—a higher price cannot induce an increase in the quantity supplied. There are even cases, which we investigate in microeconomic analysis, in which a higher price induces a reduction in the quantity supplied.
Generally speaking, however, when there are many sellers of a good, an increase in price results in a greater quantity supplied. The relationship between price and quantity supplied is suggested in a supply schedule, a table that shows quantities supplied at different prices during a particular period, all other things unchanged. Figure 3.6 gives a supply schedule for the quantities of coffee that will be supplied per month at various prices, ceteris paribus. At a price of $4 per pound, for example, producers are willing to supply 15 million pounds of coffee per month. A higher price, say $6 per pound, induces sellers to supply a greater quantity—25 million pounds of coffee per month.
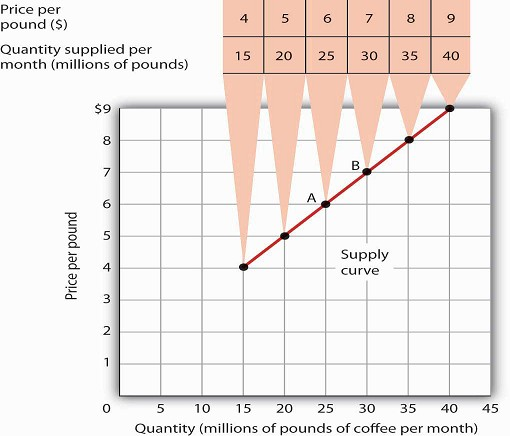
The supply schedule shows the quantity of coffee that will be supplied in the United States each month at particular prices, all other things unchanged. The same information is given graphically in the supply curve. The values given here suggest a positive relationship between price and quantity supplied.
A supply curve is a graphical representation of a supply schedule. It shows the relationship between price and quantity supplied during a particular period, all other things unchanged. Because the relationship between price and quantity supplied is generally positive, supply curves are generally upward sloping. The supply curve for coffee in Figure 3.6 shows graphically the values given in the supply schedule.
A change in price causes a movement along the supply curve; such a movement is called a change in quantity supplied. As is the case with a change in quantity demanded, a change in quantity supplied does not shift the supply curve. By definition, it is a movement along the supply curve. For example, if the price rises from $6 per pound to $7 per pound, the quantity supplied rises from 25 million pounds per month to 30 million pounds per month. That’s a movement from point A to point B along the supply curve in Figure 3.6.
- 2959 reads
