


Think about the last thing you purchased. You bought it because you expected that its benefits would exceed its opportunity cost; you expected that the purchase would make you better off. The seller sold it to you because he or she expected that the money you paid would be worth more than the value of keeping the item. The seller expected to be better off as a result of the sale. Exchanges in the marketplace have a remarkable property: Both buyers and sellers expect to emerge from the transaction better off.
Panel (a) of Figure 6.9 shows a market demand curve for a particular good. Suppose the price equals OB and the quantity equals OE. The area under the demand curve over the range of quantities from the origin at O to the quantity at E equals the total benefit of consuming OE units of the good. It is the area OCDE. Consumers pay for this benefit; their total expenditures equal the rectangle OBDE, which is the dark shaded region in the graph. Because the total benefits exceed total expenditures, there is a consumer surplus given by the triangle BCD. Consumer surplus is the amount by which the total benefits to consumers from consuming a good exceed their total expenditures on the good.
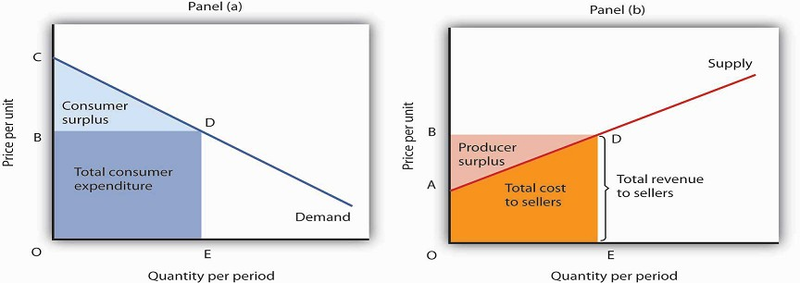
Consumer surplus [Panel (a)] measures the difference between total benefit of consuming a given quantity of output and the total expenditures consumers pay to obtain that quantity. Here, total benefits are given by the shaded area OCDE; total expenditures are given by the rectangle OBDE. The difference, shown by the triangle BCD, is consumer surplus. Producer surplus [Panel b)] measures the difference between total revenue received by firms at a given quantity of output and the total cost of producing it. Here, total revenue is given by the rectangle OBDE, and total costs are given by the area OADE. The difference, shown by the triangle ABD is producer surplus.
Now consider the sellers’ side of transactions. Panel (b) of Figure 6.9 shows a market supply curve; recall that it gives us marginal cost. Suppose the market price equals OB and quantity supplied is OE; those are the same values we had in Panel (a). The price times the quantity equals the total revenue received by sellers. It is shown as the shaded rectangle OBDE. The total revenue received by sellers equals total expenditures by consumers.
The total cost to sellers is the area under the marginal cost curve; it is the area OADE. That cost is less than revenue. The difference between the total revenue received by sellers and their total cost is called producer surplus. In Panel (b) it is the light-shaded triangle ABD.
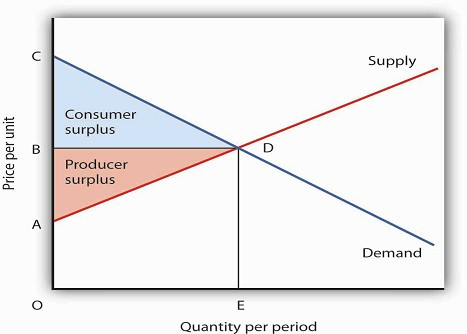
The sum of consumer surplus and producer surplus measures the net benefit to society of any level of economic activity. Net benefit is maximized when production and consumption are carried out at the level where the demand and supply curves intersect. Here, the net benefit to society equals the area ACD. It is the sum of consumer surplus, BCD, and producer surplus, ABD.
We put the demand and supply curves of Figure 6.9 Panels (a) and (b) together in Figure 6.10. The intersection of the two curves determines the equilibrium price, OB, and the equilibrium quantity, OE. The shaded regions give us consumer and producer surplus. The sum of these two surpluses is net benefit. This net benefit is maximized where the demand and supply curves intersect.
- 5120 reads
