


Summary
In this chapter we have examined the model of utility-maximizing behavior. Economists assume that consumersmake choices consistent with the objective of achieving the maximum total utility possible for a given budget constraint.
Utility is a conceptual measure of satisfaction; it is not actually measurable. The theory of utility maximization allows us to ask how a utility-maximizing consumer would respond to a particular event.
By following the marginal decision rule, consumers will achieve the utility-maximizing condition: Expendituresequal consumers’ budgets, and ratios of marginal utility to price are equal for all pairs of goods and services.Thus, consumption is arranged so that the extra utility per dollar spent is equal for all goods and services. The marginal utility from a particular good or service eventually diminishes as consumers consume more of it during a period of time.
Utility maximization underlies consumer demand. The amount by which the quantity demanded changes inresponse to a change in price consists of a substitution effect and an income effect. The substitution effect always changes quantity demanded in a manner consistent with the law of demand. The income effect of aprice change reinforces the substitution effect in the case of normal goods, but it affects consumption in an opposite direction in the case of inferior goods.
An alternative approach to utility maximization uses indifference curves. This approach does not rely on the concept of marginal utility, and it gives us a graphical representation of the utility-maximizing condition.
CONCEPT PROBLEMS
- Suppose you really, really like ice cream. You adore ice cream. Does the law of diminishing marginal utilityapply to your ice cream consumption?
- If two commodities that you purchase on a regular basis carry the same price, does that mean they both provide the same total utility? Marginal utility?
- If a person goes to the bowling alley planning to spend $15 but comes away with $5, what, if anything,can you conclude about the marginal utility of the alternatives (for example, bowl another line, have a soda or a sandwich) available to the person at the time he or she leaves?
- Which do you like more—going to the movies or watching rented DVDs at home? If you engage in both activities during the same period, say a week, explain why.
- Do you tend to eat more at a fixed-price buffet or when ordering from an a la carte menu? Explain, using the marginal decision rule that guides your behavior.
- Suppose there is a bill to increase the tax on cigarettes by $1 per pack coupled with an income tax cut of$500. Suppose a person smokes an average of 500 packs of cigarettes per year—and would thus face a tax increase of about $500 per year from the cigarette tax at the person’s current level of consumption. Theincome tax measure would increase the person’s after-tax income by $500. Would the combined measures be likely to have any effect on the person’s consumption of cigarettes? Why or why not?
- How does an increase in income affect a consumer’s budget line? His or her total utility?
- Why can Ms. Bain not consume at point Y in Figure 7.13?
- Suppose Ms. Bain is now consuming at point V in Figure 7.13. Use the marginal decision rule to explainwhy a shift to X would increase her utility.
- Suppose that you are a utility maximizer and so is your economics instructor. What can you concludeabout your respective marginal rates of substitution for movies and concerts?
NUMERICAL PROBLEMS
-
The table shows the total utility Joseph derives from eating pizza in the evening while studying.
- How much marginal utility does Joseph derive from the third piece of pizza?
- After eating how many pieces of pizza does marginal utility start to decline?
- If the pizza were free, what is the maximum number of pieces Joseph would eat in an evening?
- On separate diagrams, construct Joseph’s total utility and marginal utility curves for pizza. Does the law of diminishing marginal utility hold? How do you know?
|
Pieces of pizza/evening |
Total Utility |
|---|---|
|
0 |
0 |
|
1 |
30 |
|
2 |
48 |
|
3 |
60 |
|
4 |
70 |
|
5 |
78 |
|
6 |
80 |
|
7 |
86 |
- Suppose the marginal utility of good A is 20 and its price is $4, and the marginal utility of good B is 50 and its price is $5. The individual to whom this information applies is spending $20 on each good. Is he or she maximizing satisfaction? If not, what should the individual do to increase total satisfaction? On the basis of this information, can you pick an optimum combination? Why or why not?
- John and Marie settle down to watch the evening news. Marie is content to watch the entire program while John continually switches channels in favor of possible alternatives. Draw the likely marginal utility curves for watching the evening news for the two individuals. Whose marginal utility curve is likely to be steeper?
- Li, a very careful maximizer of utility, consumes two services, going to the movies and bowling. She has arranged her consumption of the two activities so that the marginal utility of going to a movie is 20 and the marginal utility of going bowling is 10. The price of going to a movie is $10, and the price of going bowling is $5. Show that she is satisfying the requirement for utility maximization. Now show what happens when the price of going bowling rises to $10.
- The table shows the total utility (TU) that Jeremy receives from consuming different amounts of two goods, X and Y, per month.
- Fill in the other columns of the table by calculating the marginal utilities for goods X and Y and the ratios of marginal utilities to price for the two goods. Assume that the price of both goods X and Y is $3. Be sure to use the “midpoint convention” when you fill out the table.
- If Jeremy allocates $30 to spend on both goods, how many units will he buy of each?
- How much will Jeremy spend on each good at the utility maximizing combination?
- How much total utility will Jeremy experience by buying the utility-maximizing combination?
- Suppose the price of good Y increases to $6. How many units of X and Y will he buy to maximize his utility now?
- Draw Jeremy’s demand curve for good Y between the prices of $6 and $3.
|
Quantity |
TUX |
MUX |
MUX/PX |
TUY |
MUY |
MUY/PY |
|---|---|---|---|---|---|---|
|
0 |
0 |
0 |
||||
|
1 |
50 |
75 |
||||
|
2 |
88 |
117 |
||||
|
3 |
121 |
153 |
||||
|
4 |
150 |
181 |
||||
|
5 |
175 |
206 |
||||
|
6 |
196 |
225 |
||||
|
7 |
214 |
243 |
||||
|
8 |
229 |
260 |
||||
|
9 |
241 |
276 |
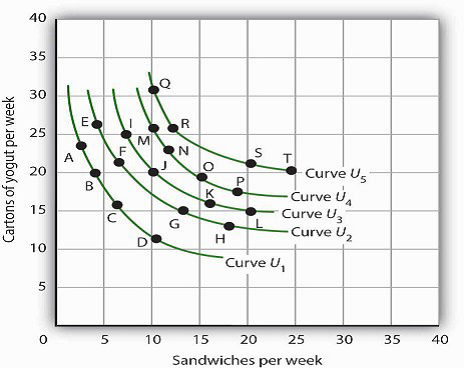
- Sid is a commuter-student at his college. During the day, he snacks on cartons of yogurt and the “house special” sandwiches at the Student Center cafeteria. A carton of yogurt costs
$1.20; the Student Center often offers specials on the sandwiches, so their price varies a great deal. Sid has a budget of $36 per week for food at the Center. Five of Sid’s indifference
curves are given by the schedule below; the points listed in the tables correspond to the points shown in the graph.
- Use the set of Sid’s indifference curves shown as a guide in drawing your own graph grid. Draw Sid’s indifference curves and budget line, assuming sandwiches cost $3.60. Identify the point at which he maximizes utility. How many sandwiches will he consume? How many cartons of yogurt? (Hint: All of the answers in this exercise occur at one of the combinations given in the tables on this page.)
- Now suppose the price of sandwiches is cut to $1.20. Draw the new budget line. Identify the point at which Sid maximizes utility. How many sandwiches will he consume? How many cartons of yogurt?
- Now draw the budget lines implied by a price of yogurt of $1.20 and sandwich prices of $0.90and $1.80. With the observations you’ve already made for sandwich prices of $3.60 and $1.20,draw the demand curve. Explain how this demand curve illustrates the law of demand.
|
Curve U1 |
|
|---|---|
|
Point on curve |
Sandwiches |
|
A |
2 |
|
B |
4 |
|
C |
7 |
|
D |
10 |
|
Curve U2 |
||
|---|---|---|
|
Point on curve |
Sandwiches |
Yogurt |
|
E |
4 |
26 |
|
F |
6 |
21 |
|
G |
13 |
15 |
|
H |
18 |
13 |
|
Curve U3 |
||
|---|---|---|
|
Point on curve |
Sandwiches |
Yogurt |
|
I |
7 |
25 |
|
J |
10 |
20 |
|
K |
16 |
16 |
|
L |
20 |
15 |
|
Curve U4 |
||
|---|---|---|
|
Point on curve |
Sandwiches |
Yogurt |
|
M |
10 |
26 |
|
N |
12 |
23 |
|
O |
15 |
18 |
|
P |
19 |
17 |
|
Curve U5 |
||
|---|---|---|
|
Point on curve |
Sandwiches |
Yogurt |
|
Q |
10 |
31 |
|
R |
12 |
26 |
|
S |
20 |
21 |
|
T |
24 |
20 |
- Consider a consumer who each week purchases two goods, X and Y. The following table shows three different combinations of the two goods that lie on three of her indifference curves—A, B,
and C.
- With good X on the horizontal axis and good Y on the vertical axis, draw the implied indifference curves. Be sure to label all curves and axes completely.
- On Curve A, what is the marginal rate of substitution (MRS) between the first two combinations of goods X and Y?
- Suppose this consumer has $500 available to spend on goods X and Y and that each costs $100. Add her budget line to the graph you drew in part (a). What is the slope of the budget line?
- What is the utility-maximizing combination of goods X and Y for this consumer? (Assume in this exercise that the utility-maximizing combination always occurs at one of the combinations shown in the table.)
- What is the MRS at the utility-maximizing combination?
- Now suppose the price of good X falls to $50. Draw the new budget line onto your graph and identify the utility-maximizing combination. What is the MRS at the utility-maximizing combination? How much of each good does she consume?
- Draw the demand curve for good X between prices of $50 and $100, assuming it is linear in this range.
|
Indifference Curve |
Quantities of goods X and Y, respectively |
Quantities of goods X and Y, respectively |
Quantities of goods X and Y, respectively |
|---|---|---|---|
|
A |
1 unit of X and 4 of Y |
2 units of X and 2 of Y |
3 units of X and 1 of Y |
|
B |
1 unit of X and 7 of |
3 units of X and 2 of |
5 units of X and 1 |
|
C |
2 units of X and 5 of Y |
4 units of X and 3 of Y |
7 units of X and 2 of Y |
- 1635 reads
