


A firm uses factors of production to produce a product. The relationship between factors of production and the output of a firm is called a production function Our first task is to explore the nature of the production function.
Consider a hypothetical firm, Acme Clothing, a shop that produces jackets. Suppose that Acme has a lease on its building and equipment. During the period of the lease, Acme’s capital is its fixed factor of production. Acme’s variable factors of production include things such as labor, cloth, and electricity. In the analysis that follows, we shall simplify by assuming that labor is Acme’s only variable factor of production.
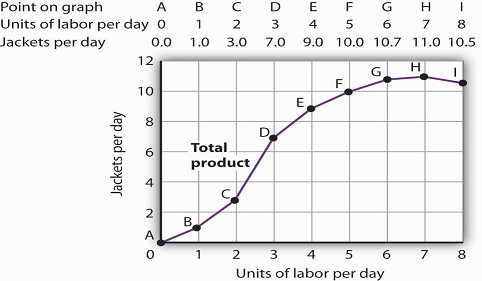
The table gives output levels per day for Acme Clothing Company at various quantities of labor per day, assuming the firm’s capital is fixed. These values are then plotted graphically as a total product curve.
Total, Marginal, and Average Products
Figure 8.1 shows the number of jackets Acme can obtain with varying amounts of labor (in this case, tailors) and its given level of capital. A total product curve shows the quantities of output that can be obtained from different amounts of a variable factor of production, assuming other factors of production are fixed.
Notice what happens to the slope of the total product curve in Figure 8.1. Between 0 and 3 units of labor per day, the curve becomes steeper. Between 3 and 7 workers, the curve continues to slope upward, but its slope diminishes.
Beyond the seventh tailor, production begins to decline and the curve slopes downward. We measure the slope of any curve as the vertical change between two points divided by the horizontal
change between the same two points. The slope of the total product curve for labor equals the change in output (ΔQ) divided by the change in units of labor (ΔL):
Slope of the total product curve = ΔQ / ΔL
The slope of a total product curve for any variable factor is a measure of the change in output associated with a change in the amount of the variable factor, with the quantities of all other factors held constant. The amount by which output rises with an additional unit of a variable factor is the marginal product of the variable factor. Mathematically, marginal product is the ratio of the change in output to the change in the amount of a variable factor. The marginal product of labor (MPL), for example, is the amount by which output rises with an additional unit of labor. It is thus the ratio of the change in output to the change in the quantity of labor (ΔQ/ΔL), all other things unchanged. It is measured as the slope of the total product curve for labor.
EQUATION 8.1
MPL = ΔQ / ΔL
In addition we can define the average product of a variable factor. It is the output per unit of variable factor. The average product of labor (APL), for example, is the ratio of output to the number of units of labor (Q/L).
EQUATION 8.2
APL = Q / L
The concept of average product is often used for comparing productivity levels over time or in comparing productivity levels among nations. When you read in the newspaper that productivity is rising or falling, or that productivity in the United States is nine times greater than productivity in China, the report is probably referring to some measure of the average product of labor.
The total product curve in Panel (a) of Figure 8.2 is repeated from Figure 8.1. Panel (b) shows the marginal product and average product curves. Notice that marginal product is the slope of the total product curve, and that marginal product rises as the slope of the total product curve increases, falls as the slope of the total product curve declines, reaches zero when the total product curve achieves its maximum value, and becomes negative as the total product curve slopes downward. As in other parts of this text, marginal values are plotted at the midpoint of each interval. The marginal product of the fifth unit of labor, for example, is plotted between 4 and 5 units of labor. Also notice that the marginal product curve intersects the average product curve at the maximum point on the average product curve. When marginal product is above average product, average product is rising. When marginal product is below average product, average product is falling.
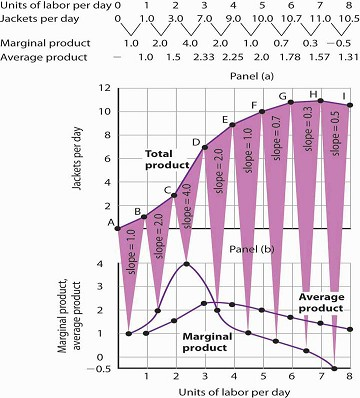
The first two rows of the table give the values for quantities of labor and total product from Figure 8.1. Marginal product, given in the third row, is the change in output resulting from a one-unit increase in labor. Average product, given in the fourth row, is output per unit of labor. Panel (a) shows the total product curve. The slope of the total product curve is marginal product, which is plotted in Panel (b). Values for marginal product are plotted at the midpoints of the intervals. Average product rises and falls. Where marginal product is above average product, average product rises. Where marginal product is below average product, average product falls. The marginal product curve intersects the average product curve at the maximum point on the average product curve.
As a student you can use your own experience to understand the relationship between marginal and average values. Your grade point average (GPA) represents the average grade you have earned in all your course work so far. When you take an additional course, your grade in that course represents the marginal grade. What happens to your GPA when you get a grade that is higher than your previous average? It rises. What happens to your GPA when you get a grade that is lower than your previous average? It falls. If your GPA is a 3.0 and you earn one more B, your marginal grade equals your GPA and your GPA remains unchanged.
The relationship between average product and marginal product is similar. However, unlike your course grades, which may go up and down willy-nilly, marginal product always rises and then falls, for reasons we will explore shortly. As soon as marginal product falls below average product, the average product curve slopes downward. While marginal product is above average product, whether marginal product is increasing or decreasing, the average product curve slopes upward.
As we have learned, maximizing behavior requires focusing on making decisions at the margin. For this reason, we turn our attention now toward increasing our understanding of marginal product.
- 15757 reads
