


Our analysis of Carol Stein’s decision regarding the purchase of a new tractor suggests the forces at work in determining the economy’s demand for capital. In deciding to purchase the tractor, Ms. Stein considered the price she would have to pay to obtain the tractor, the costs of operating it, the marginal revenue product she would receive by owning it, and the price she could get by selling the tractor when she expects to be done with it. Notice that with the exception of the purchase price of the tractor, all those figures were projections. Her decision to purchase the tractor depends almost entirely on the costs and benefits she expects will be associated with its use.
Finally, Ms. Stein converted all those figures to a net present value based on the interest rate prevailing at the time she made her choice. A positive NPV means that her profits will be increased by purchasing the tractor. That result, of course, depends on the prevailing interest rate. At an interest rate of 7%, the NPV is positive. At an interest rate of 8%, the NPV would be negative. At that interest rate, Ms.Stein would do better to put her funds elsewhere.
At any one time, millions of choices like that of Ms. Stein concerning the acquisition of capital will be under consideration. Each decision will hinge on the price of a particular piece of capital, the expected cost of its use, its expected marginal revenue product, its expected scrap value, and the interest rate.Not only will firms be considering the acquisition of new capital, they will be considering retaining existing capital as well. Ms. Stein, for example, may have other tractors. Should she continue to use them, or should she sell them? If she keeps them, she will experience a stream of revenues and costs over the next several periods; if she sells them, she will have funds now that she could use for something else. To decide whether a firm should keep the capital it already has, we need an estimate of the NPV of each unit of capital. Such decisions are always affected by the interest rate. At higher rates of interest, it makes sense to sell some capital rather than hold it. At lower rates of interest, the NPV of holding capital will rise.
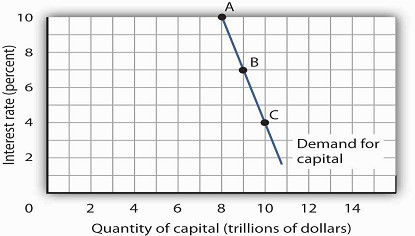
Because firms’ choices to acquire new capital and to hold existing capital depend on the interest rate, the demand curve for capital in Figure 13.1 below, which shows the quantity of capital firms intend to hold at each interest rate, is downward-sloping. At point A, we see that at an interest rate of 10%, $8 trillion worth of capital is demanded in the economy. At point B, a reduction in the interest rate to 7% increases the quantity of capital demanded to $9 trillion. At point C, at an interest rate of 4%, the quantity of capital demanded is $10 trillion. A reduction in the interest rate increases the quantity of capital demanded.
The demand curve for capital for the economy is found by summing the demand curves of all holders of capital. Ms. Stein’s demand curve, for example, might show that at an interest rate of 8%, she will demand the capital she already has—suppose it is $600,000 worth of equipment. If the interest rate drops to 7%, she will add the tractor; the quantity of capital she demands rises to $695,000. At interest rates greater than 8%,she might decide to reduce her maintenance efforts for some of the capital she already has; the quantity of capital she demands would fall below $600,000. As with the demand for capital in the economy, we can expect individual firms to demand a smaller quantity of capital when the interest rate is higher.
- 5001 reads
